perf(profiling): speed up stack walking by using function run_time_cache - #1949
Merged
Conversation


Collaborator
Author
|
Numbers time! Using the Datadog native profiler, I analyzed memory and CPU characteristics. Here's the short version:
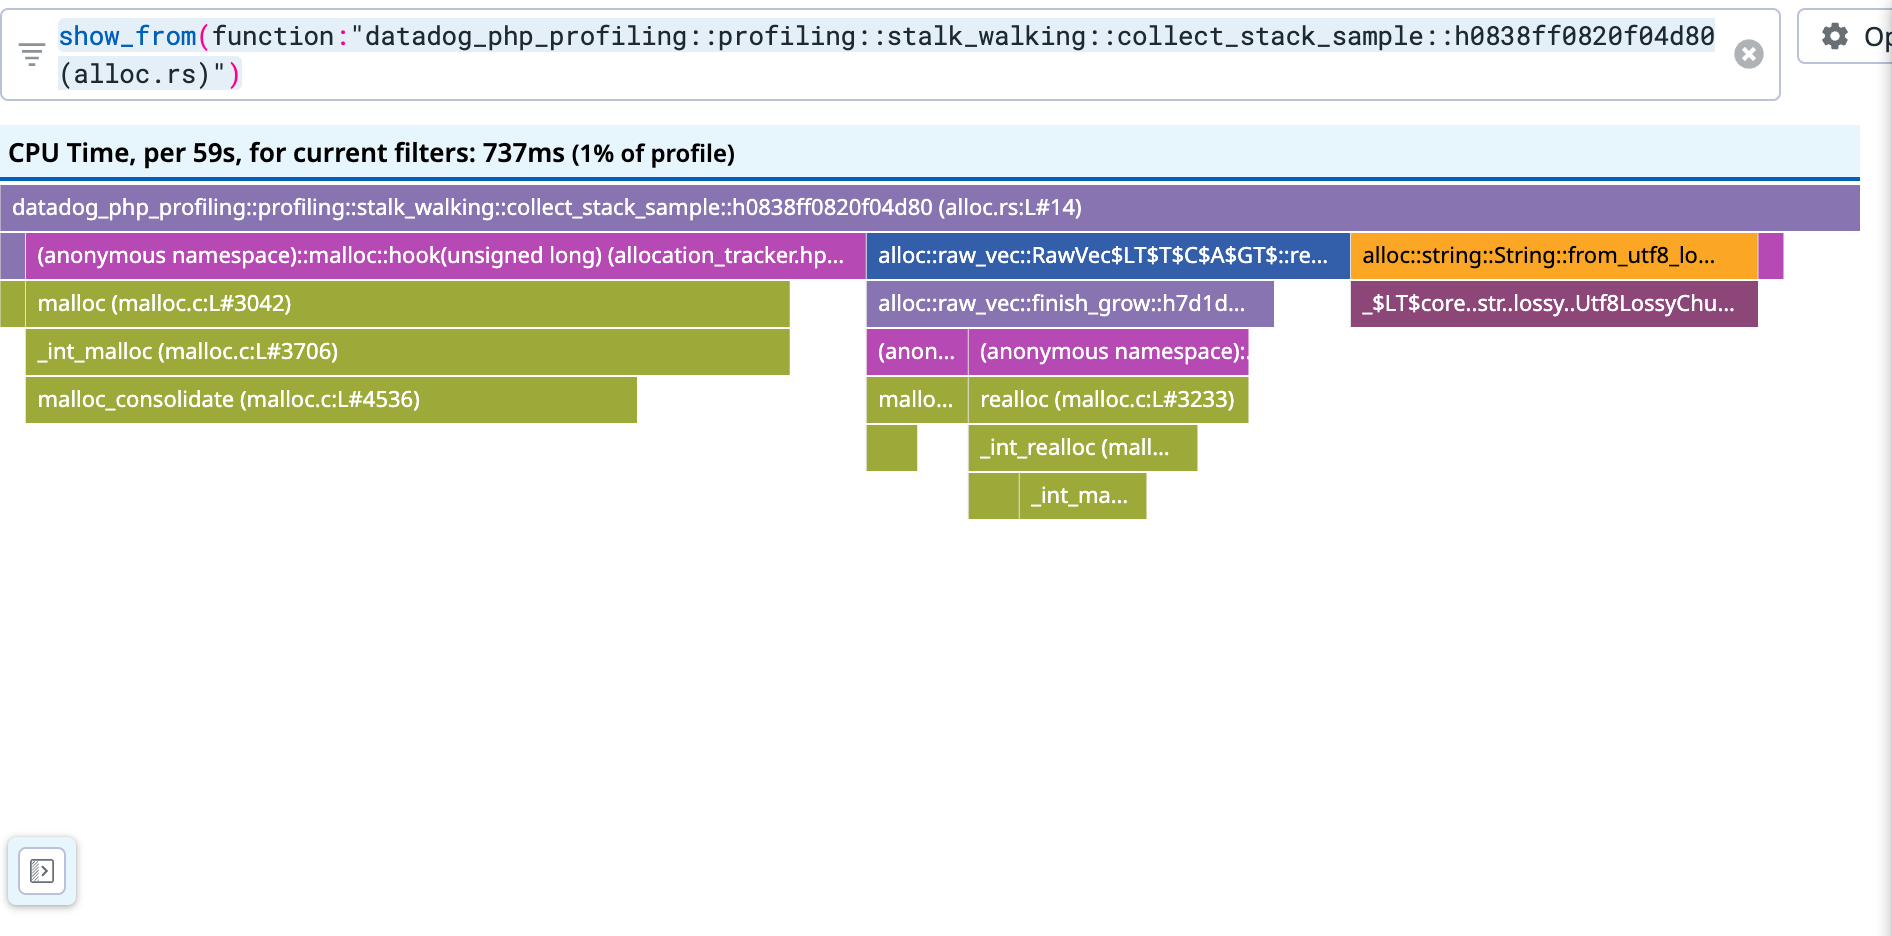
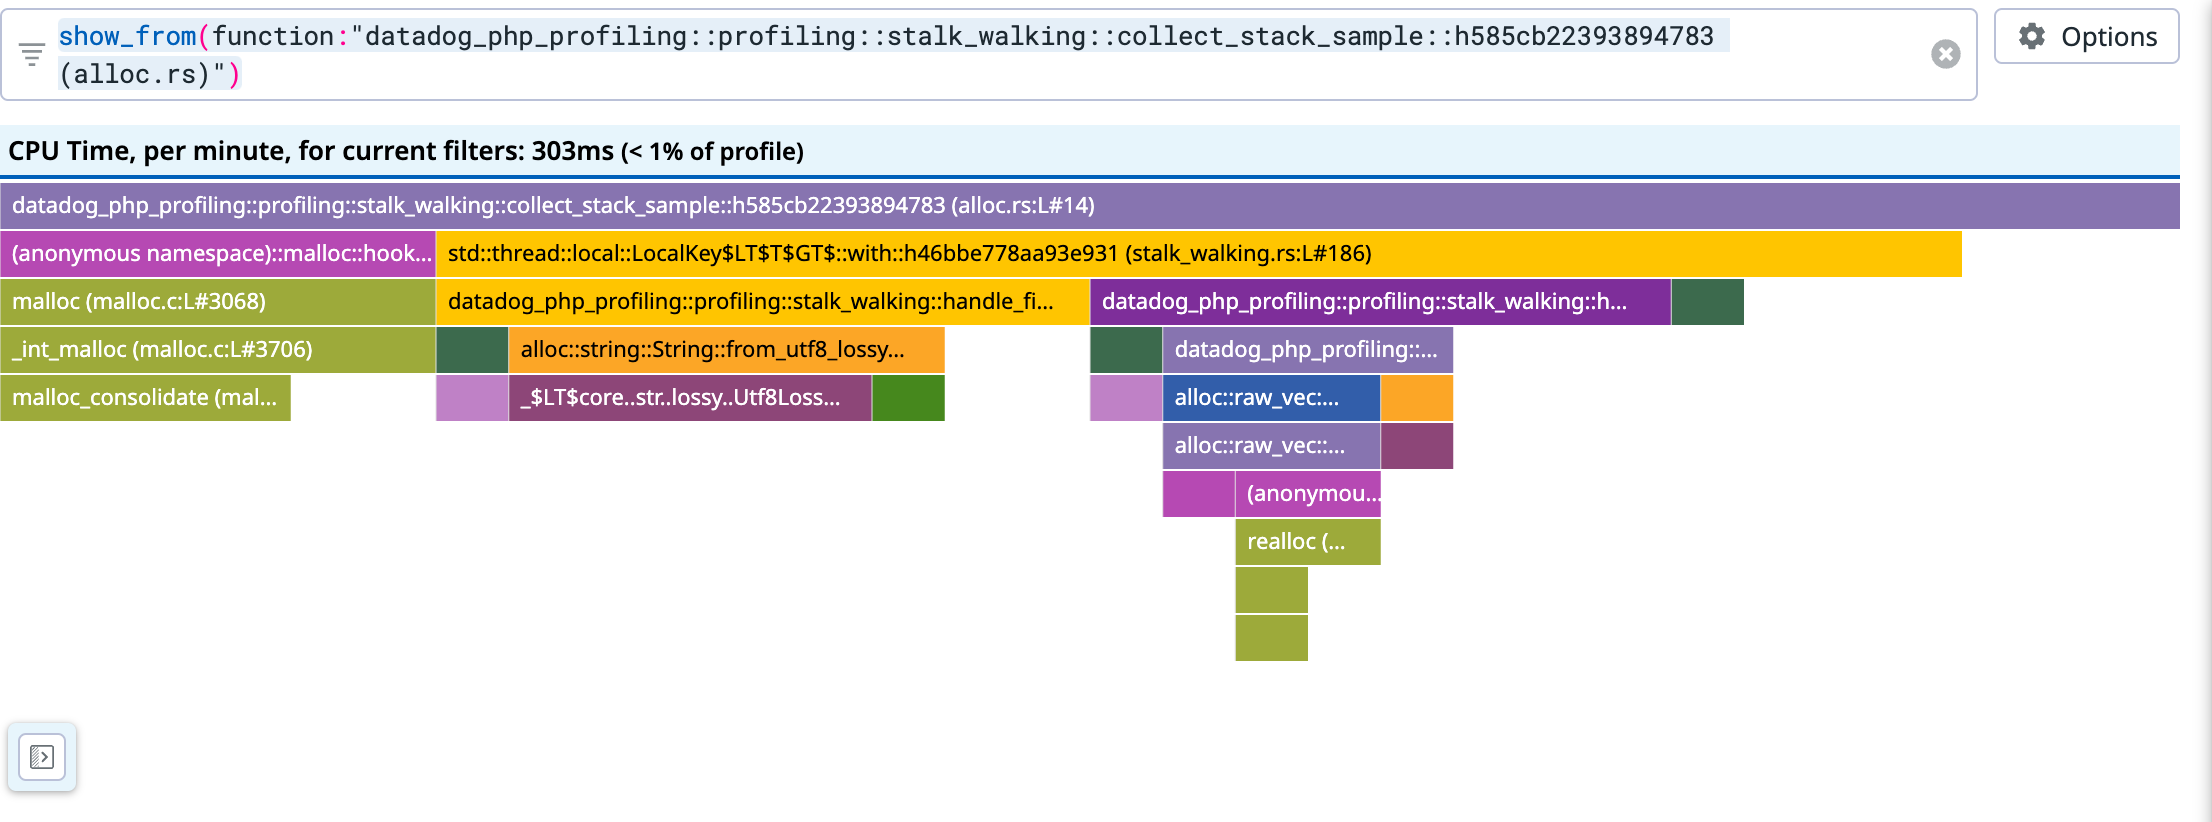
In all cases, the total memory in use goes up a bit as the Some screenshots: CPU time before/after. This is with allocation profiling enabled.
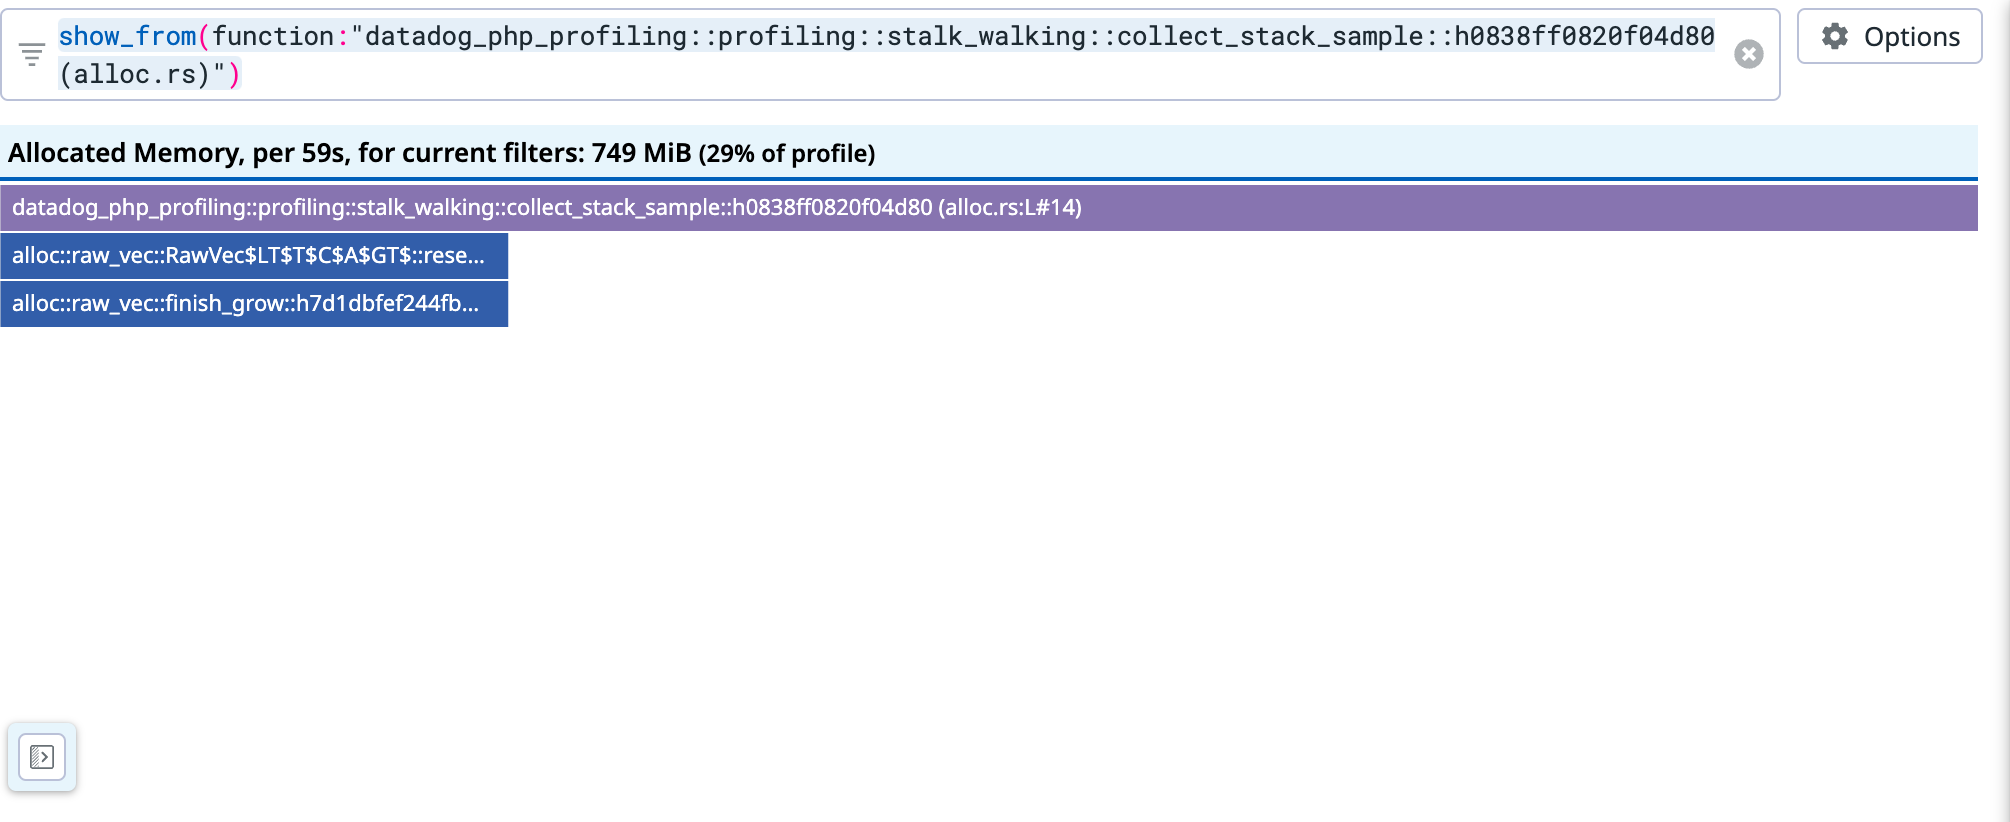
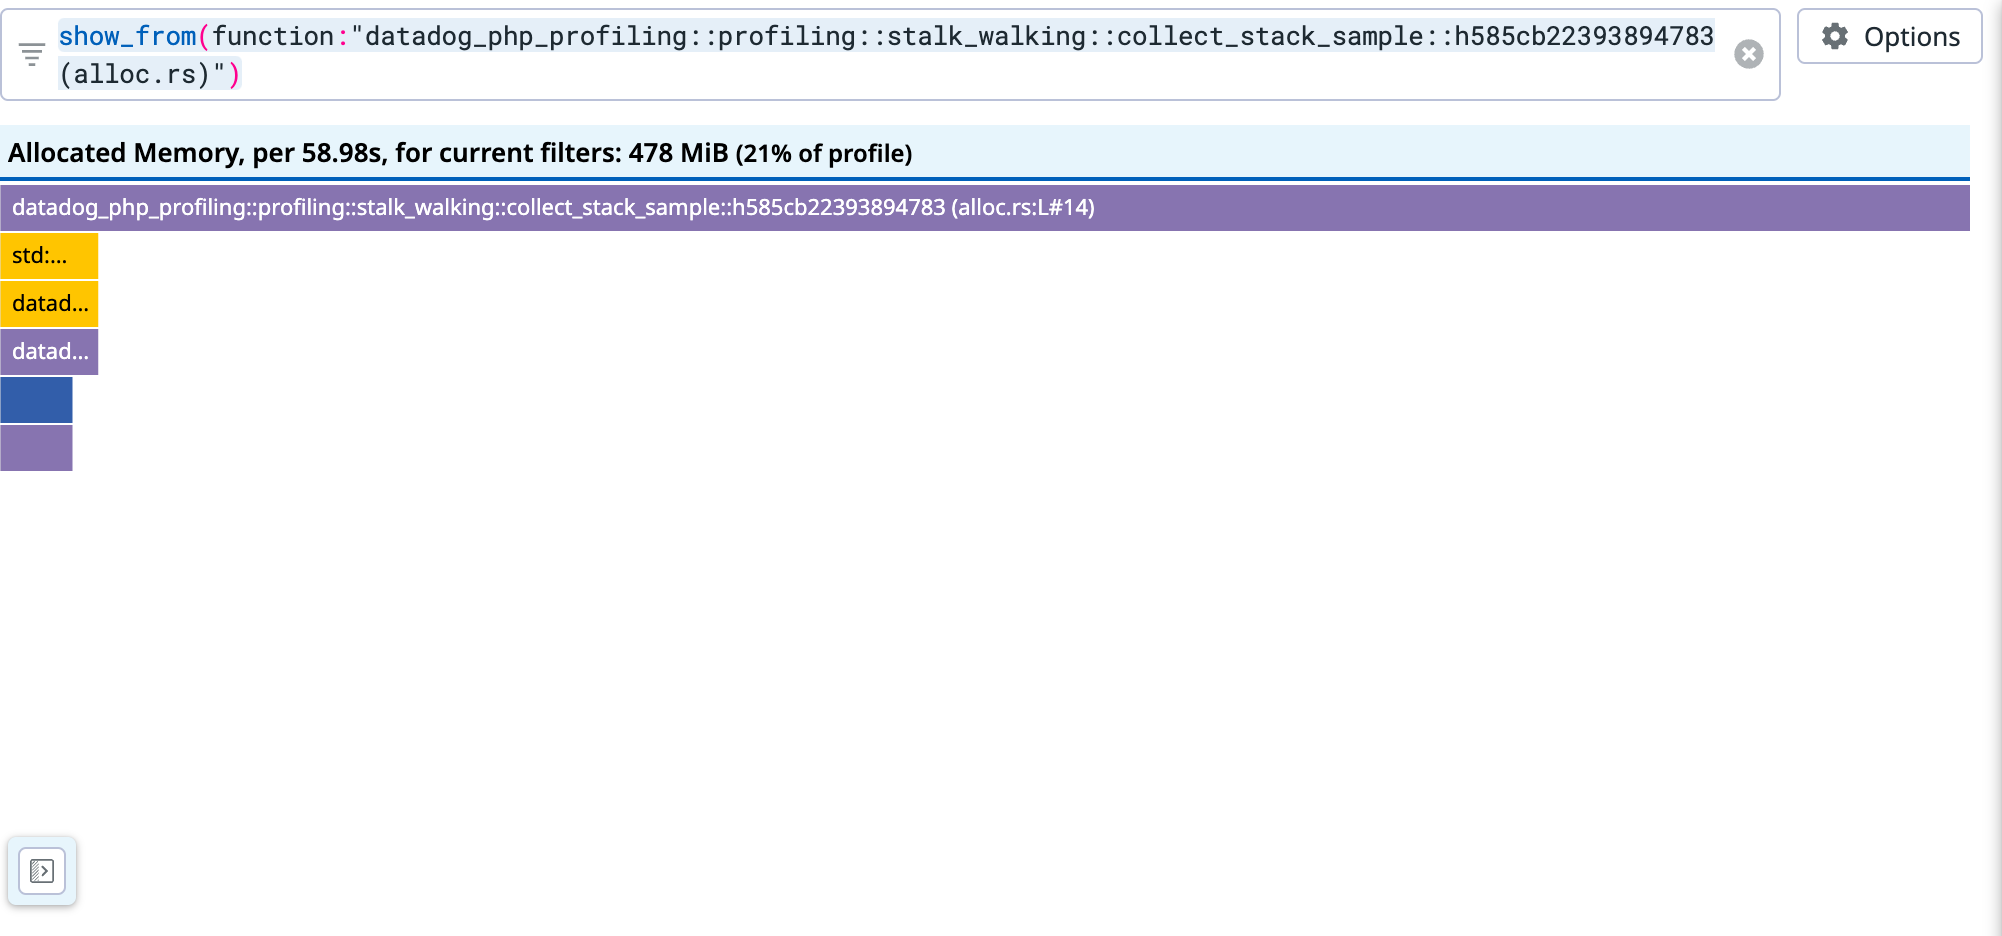
Bytes allocated before/after. Again, with allocation profiling enabled.
|

r1viollet
reviewed
Mar 2, 2023
r1viollet
reviewed
Mar 2, 2023
r1viollet
reviewed
Mar 2, 2023
r1viollet
reviewed
Mar 2, 2023


bwoebi
reviewed
Mar 2, 2023
 morrisonlevi
changed the title
morrisonlevi
changed the title


realFlowControl
approved these changes
Mar 22, 2023


This file contains hidden or bidirectional Unicode text that may be interpreted or compiled differently than what appears below. To review, open the file in an editor that reveals hidden Unicode characters.
Learn more about bidirectional Unicode characters
Sign up for free
to join this conversation on GitHub.
Already have an account?
Sign in to comment
4 participants


Add this suggestion to a batch that can be applied as a single commit.This suggestion is invalid because no changes were made to the code.Suggestions cannot be applied while the pull request is closed.Suggestions cannot be applied while viewing a subset of changes.Only one suggestion per line can be applied in a batch.Add this suggestion to a batch that can be applied as a single commit.Applying suggestions on deleted lines is not supported.You must change the existing code in this line in order to create a valid suggestion.Outdated suggestions cannot be applied.This suggestion has been applied or marked resolved.Suggestions cannot be applied from pending reviews.Suggestions cannot be applied on multi-line comments.Suggestions cannot be applied while the pull request is queued to merge.Suggestion cannot be applied right now. Please check back later.
Description
This is for PHP 8 only. It uses two slots in the function run_time_cache to store:
"module|Namespace\\ClassName::method".These two strings are interned and live between requests. This allows us to share them as
Cow<'static, str>with theddprof_timethread (fewer copies).This is not ZTS safe. The profiler doesn't support ZTS yet anyway, I'm just pointing this out informationally.
This is not using PHP's own interning. It uses a
OwnedStringTablewhich allocates the string data in an arena, and deduplicates using aHashMap. It also holds references to the strings in a contiguousVec; this property is not particularly useful for this PR, but it probably will be in the future with some libdatadog work. Thisstring_tablemodule has cherry-picked bits from that libdatadog work-in-process.Also fixes the initial
Vecsize in theddprof_timethread when converting aSampleMessageinto aSamplefor libdatadog. I noticed this while reviewing profiles that it was spending a good amount of time allocating.Readiness checklist
Reviewer checklist