Repository navigation
Releases: LetPeopleWork/Lighthouse
Release list
Lighthouse v26.11.1.2


Every Report in One Place, Created and Removed in Bulk
A coach looking after ten Teams had to open each one to find its reports. Rolling out the same Then & Now comparison everywhere meant running the same wizard ten times, and tidying up afterwards meant deleting ten reports one by one.
Reports in the top navigation now lists every report you can read, across all Teams and Portfolios, with its owner. Pick several and remove them in one go, or export them as one PDF, each report on its own pages. With Premium, Create reports asks for a report's settings once and creates it on every Team and Portfolio you pick.
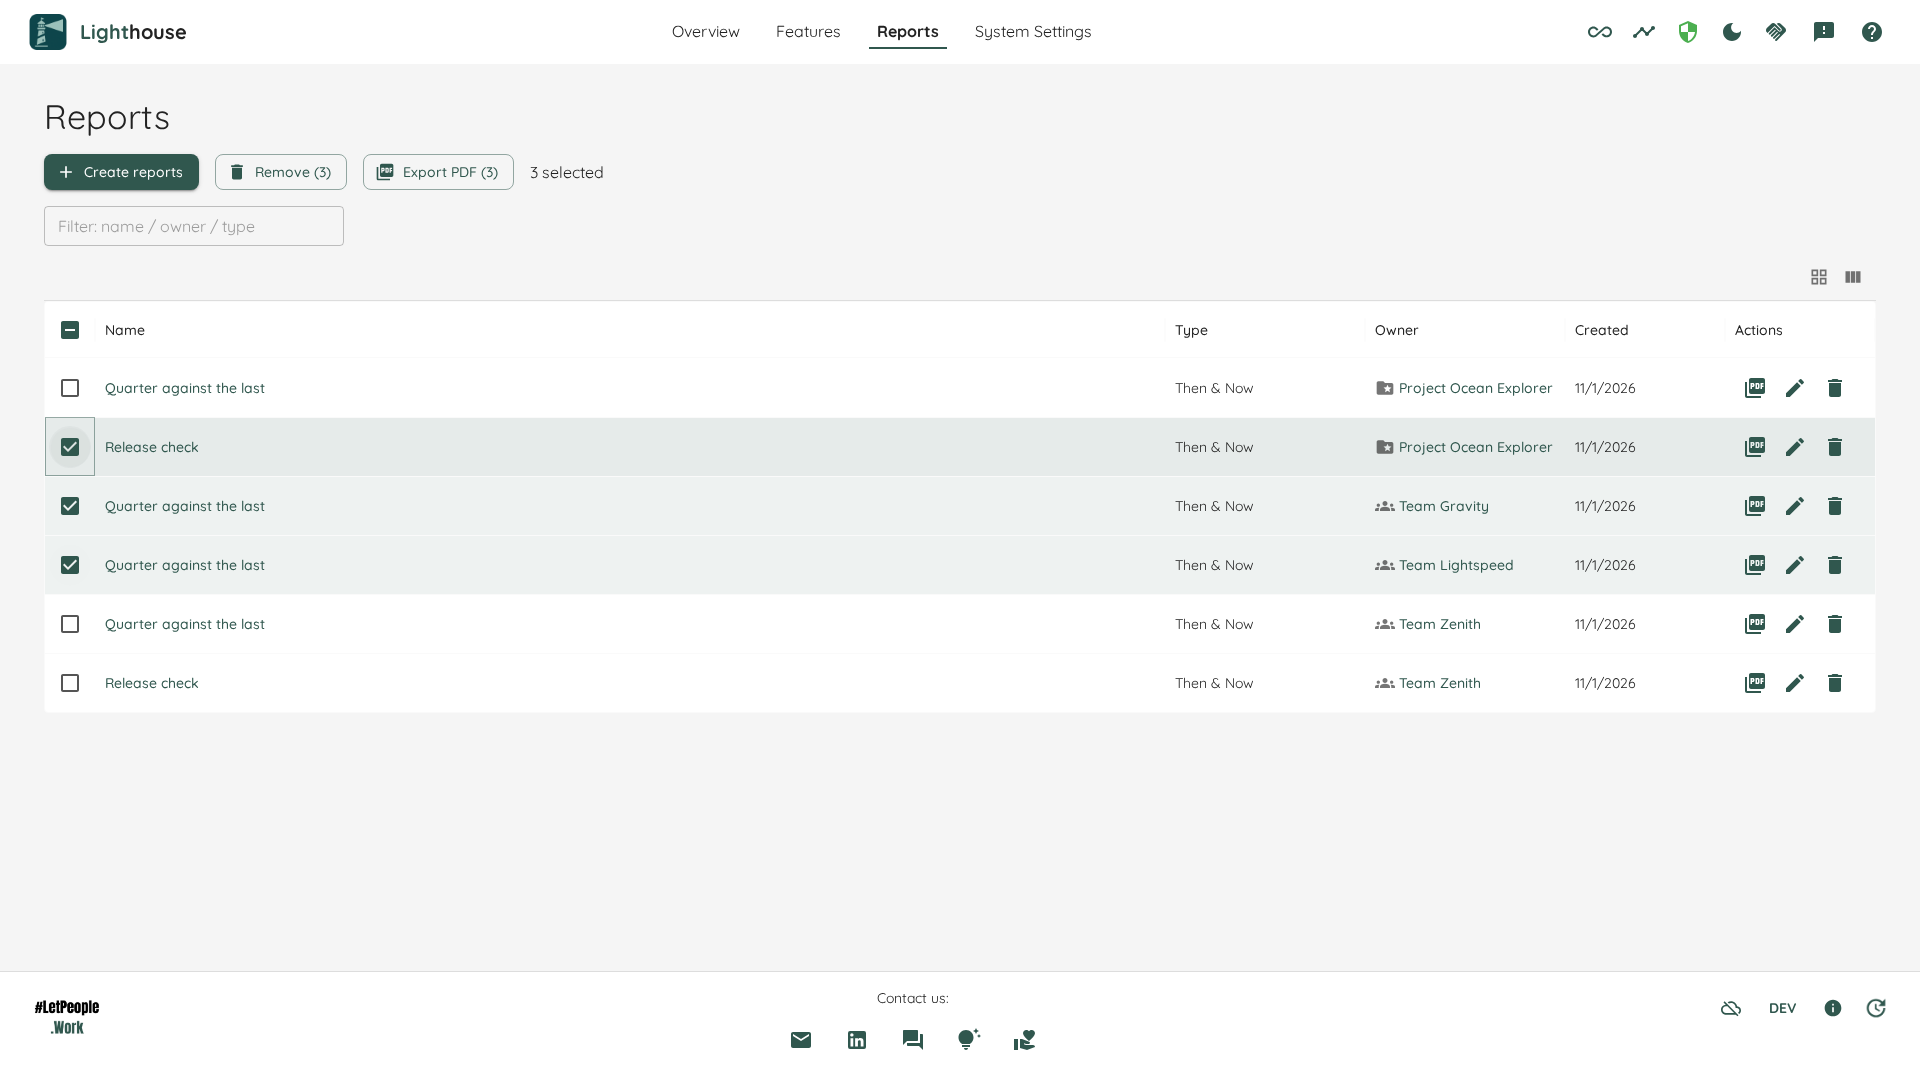
Full detail: The Reports Page.
Lighthouse Stays Fast With Many Features
A Portfolio with several hundred Features made Lighthouse feel slow: its Features tab took long to open, and its forecasts held up everything else.
The Features tabs of Teams and Portfolios now load in one request, and forecasts run on threads of their own, so the rest of Lighthouse keeps answering while they work. When a Portfolio grows past 100 Features, its settings say so, and suggest narrowing its query to keep it fast.
Full detail: Large Portfolios.
Jira Works With the Original Status and Work Item Type Names
Jira shows each person the names of statuses and work item types in their own language. A token from an account set to German made Lighthouse see In Arbeit where a colleague's English token saw In Progress, so a Team configured by one of them lost its Work Items when the token changed.
Lighthouse now always works with the original names, whatever language the token's account uses, and the Board Wizard lists those names too. After the upgrade, every Jira Team and Portfolio takes one full refresh. A Team set up with translated names needs the Board Wizard run again, or its names changed to the original ones.
Full detail: Status and Work Item Type Names.
Bugfixes and Improvements
- Every Delivery metrics chart explains itself. An ⓘ next to each chart's title says what it is for, what you see on it and how to read it. Full detail: Delivery Metrics over Time.
- Delivery forecasts respect blackout days. A Delivery's dates, and the forecasts written back to your Work Tracking System, now skip blackout days however far out the forecast reaches.
- A Team's or Portfolio's query saves when you leave the field, not while you are still typing it.
- Export PDF on the macOS desktop app is now disabled with a note, instead of doing nothing; use the browser there for now.
- Updated various third-party libraries.
Contributions ❤️
Special thanks to everyone who contributed feedback for this release:
- Steve Pereira
- Chris Graves
- Tim Brencher
Lighthouse v26.10.25.1
Export Any Report as a PDF
A report often has to reach people who never open Lighthouse: a sponsor, a steering meeting, a slide deck. Until now that meant screenshots, cropped and pasted, and already out of date by the next meeting.
Every report now has Export PDF, next to its name and in its row on the Reports tab. Lighthouse reads the report fresh and opens your browser's print dialog. Save it as a dated, branded PDF with a header and footer on every page, and you never leave the page you were on. Export PDF is part of Community.
Full detail: Export PDF.
Bugfixes and Improvements
- Quiet updates no longer recalculate your forecasts. When nothing a Portfolio's forecast reads has changed, Lighthouse confirms the forecast in seconds instead of simulating it again for minutes.
- Picking a Jira Release for a Delivery loads once and never shows a guess. The Delivery dialog shows when it is still loading or could not load. The Release picker says why a Release cannot be picked, and that you can type to search.
- Paste your Jira address straight from the browser. Jira Cloud addresses with a
/jira/path and Jira Data Center installations served under a path now work. - A failed connection save says why. The wizard tells you what went wrong and keeps your entries.
- Updated various third-party libraries.
Contributions ❤️
Special thanks to everyone who contributed feedback for this release:
Lighthouse v26.10.19.10
Set a Connection's Defaults Once, Not for Every Team
Every Team on a Jira or Azure DevOps connection that reads its parent from the same link needs its own Parent Override Field. Forget one on a new Team, and its Work Items sit unparented with nothing pointing at the cause. A Portfolio repeats the same choices for its Dependency Field, Size Estimate Field, Feature Owner Field and Estimation. Change the field on the connection, and every one of them has to be found and changed by hand.
Those settings now live on the connection, once. Set them under Defaults for Teams and Portfolios on the connection page, and every Team and Portfolio that uses that connection follows the default. A Team or Portfolio can still own its own choice, including a deliberate None, and it keeps that choice when the default changes.
- Jira and Azure DevOps offer the Parent Override Field and Estimation for Teams, and the Parent Override Field, Dependency Field, Size Estimate Field, Feature Owner Field and Estimation for Portfolios.
- CSV offers Estimation for Teams, and the Feature Owner Field and Estimation for Portfolios.
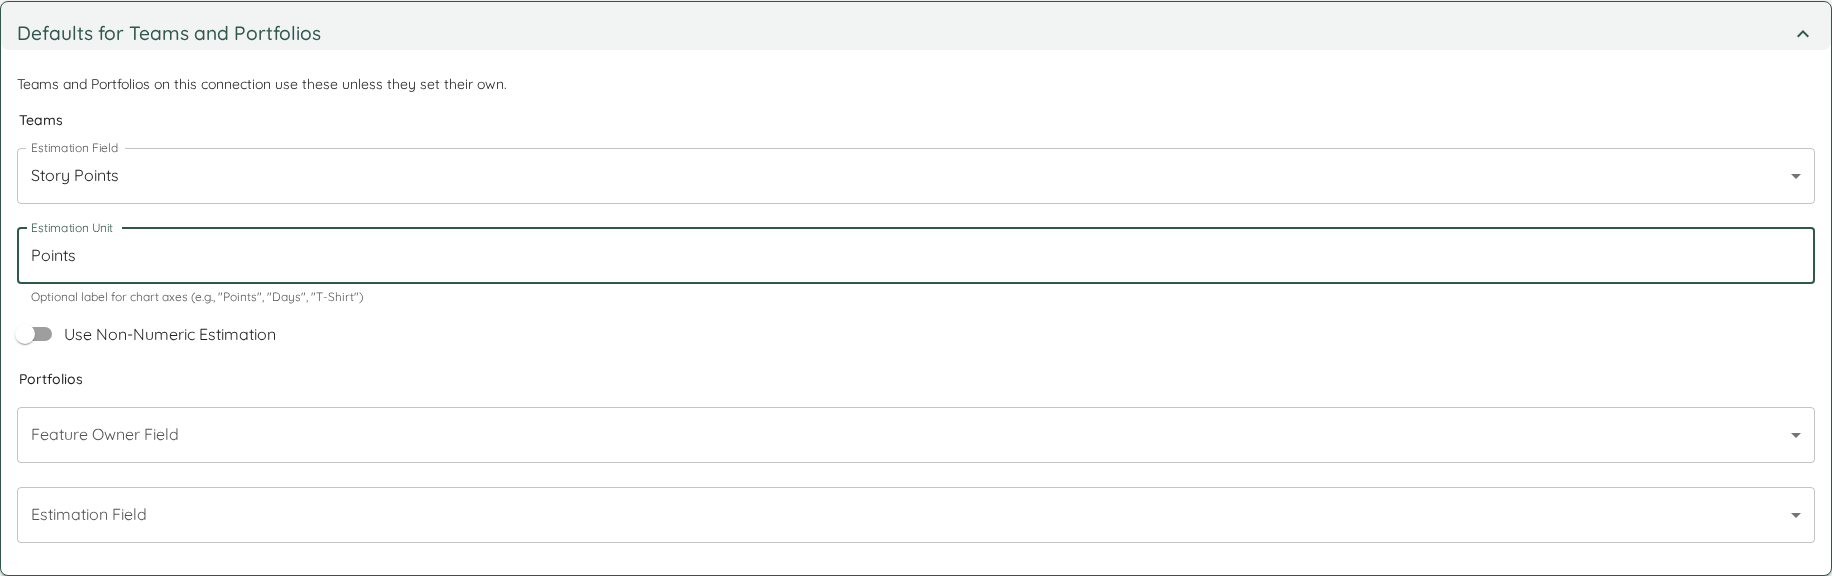
Full detail: Defaults for Teams and Portfolios.
Lighthouse Stays Responsive While Forecasts Run
A long Portfolio forecast could make Lighthouse stop answering: pages hung, refreshes sat queued behind it, and Stop did nothing. Restarting was the only way out.
Lighthouse now keeps room free to answer your requests while forecasts run. Stopping a forecast in the Task Manager ends it within seconds and keeps the forecast you had before. And when the instance is busy with more than you want, Cancel all in the Task Manager stops everything running or queued at once.
A Feature that is too big to finish within five years no longer gets an invented date decades away. Lighthouse simulates up to five years and then says More than 5 years, wherever the forecast is shown and in what it writes to your Work Tracking System. The Lighthouse CLI and MCP server say it too.
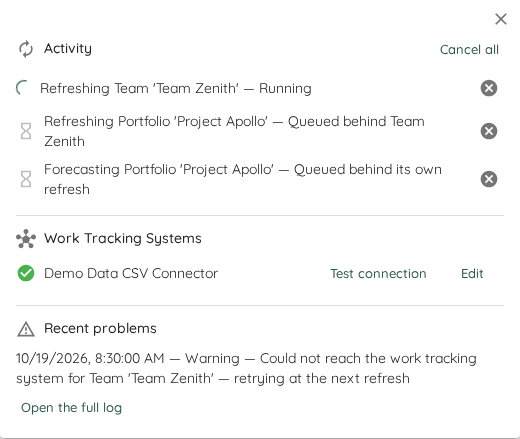 When a Forecast Reaches Beyond Five Years.
Dependencies From Any Jira Link Type or Azure DevOps Relation Type
Lighthouse only read Jira's is blocked by links and Azure DevOps Predecessor links, so a Portfolio whose waits are recorded another way showed nothing under Features → Dependencies. Name that link type, or the end of the relation type on which the work waits, as the Dependency Field, and Lighthouse reads the waits from it. A named link that no Feature carries, or one that points both ways, is reported in Refresh History.
Full detail: Jira link types and Azure DevOps relation types.
Bugfixes and Improvements
- Your AI assistant sees the same stale Work Items you do. Which Work Items are stale was worked out only in the browser, so the CLI, the MCP server and the agent skills could not tell. Lighthouse now decides it once, with one rule, and every place reads that answer: the Stale Items Overview, the red Time in State badges, the Work Item Aging Chart and the API. The Daily Flow Review skill now names stale Work Items with the reason. Full detail: What counts as stale.
- Jira Cloud Teams with long project keys refresh again. Teams whose Jira project keys are long failed on every refresh, and forecast write-backs to that connection failed too, with Jira answered 414 RequestUriTooLong. Lighthouse now sends its Jira Cloud searches in a way that has no length limit.
- Starting Lighthouse twice no longer duplicates Work Items. A second Lighthouse started on the same machine and database could not get its port, but stayed alive in the background and ran every update a second time. The two updates could store the same new Work Item twice, and from then on that Team's refresh failed. A Lighthouse that cannot start its web server now exits.
- Updated various third-party libraries.
Contributions ❤️
Special thanks to everyone who contributed feedback for this release:
Lighthouse v26.10.16.6
Feature Size on the Team
How much of a Feature does your Team usually take on? Until now, the only Feature Size chart was the Portfolio's, and it counts every Team's Work Items. A Team that wanted its own number had to open the Portfolio and subtract everyone else's.
Every Team now has the Feature Size chart and the Feature Size Percentiles widget. On a Team, a Feature's size is the Team's own share of it, and the Status Indicator flags an open Feature whose share has already grown past what the Team usually finishes. Reading the Team is enough: Features from Portfolios you cannot open are counted too, without naming those Portfolios.
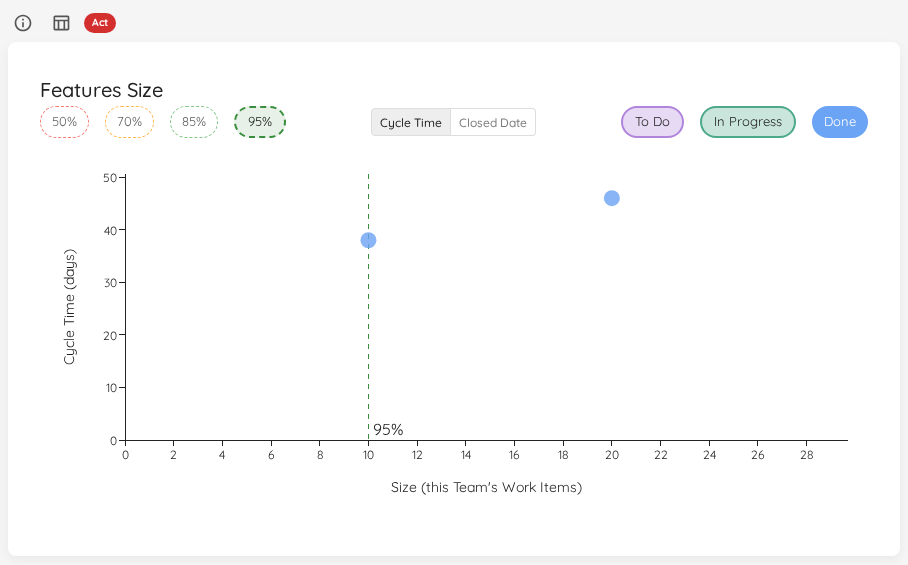
Feature Size Percentiles also gets View Data, on Teams and on Portfolios, listing the closed Features its percentiles are based on. Full detail: Feature Size on a Team.
Reporting: Then & Now
You started coaching a Team three months ago. They limited their WIP and began slicing smaller. Then someone asks: did it change anything? The Metrics tab shows only recent days, so the "before" has long dropped out of view, and screenshots taken back then never quite compare to today's.
Every Team and Portfolio now has a Reports tab, and its first report type is Then & Now. Pick a window, Then, such as the 90 days before you came in. Lighthouse freezes its flow metrics on the spot, rebuilding them from history if Then ended in the past. Now slides and always ends today. Each time you open the report, Cycle Time, Throughput, WIP and Work Item Age sit side by side, Then against Now, with the change on every line. A summary at the top tells you at a glance what improved and what got worse.
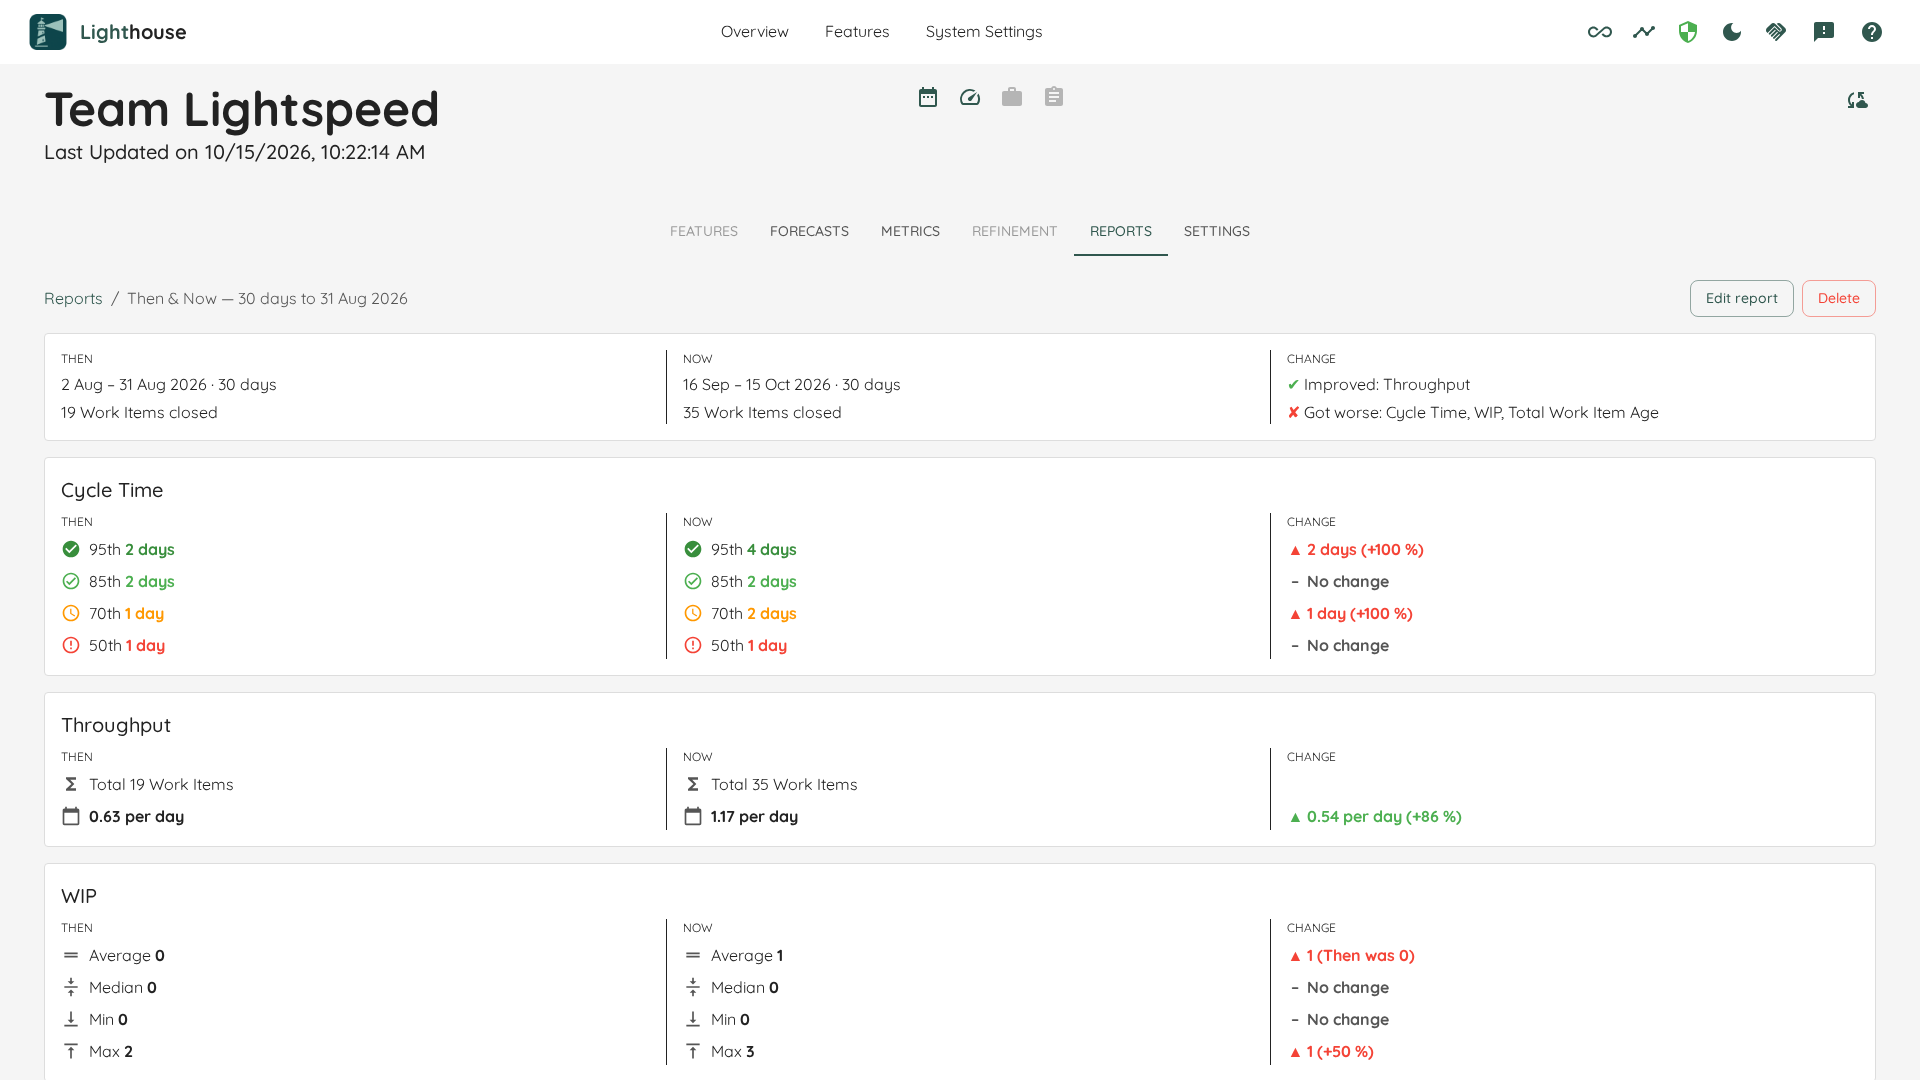
Reports are listed on the Overview next to each Team and Portfolio, so the evidence is one click away when the question comes. Community includes one Then & Now report per Team and Portfolio; Premium has no limit. Full detail: Reports.
Bugfixes and Improvements
- Clicking a chart now lists the Work Items with the columns that explain why they are there. The Estimation vs. Cycle Time dialog shows each Work Item's Estimate next to its Cycle Time, the Blocked list shows since when each Work Item is Blocked, a Feature's child items show when each started and closed, and Manage columns offers the rest; the layout you choose is remembered for each chart. Full detail: Viewing the Data Behind a Widget.
- Every row of a long list can now be reached. A list used to stop at its first 100 rows without saying there were more, so a Team with 143 Work Items in refinement could not vote on the last 43. A list of more than 100 rows now says how many it holds, for example
1–100 of 143, and its arrows page to the rest. Sorting, filtering, the search in Third-party packages, and Export and Copy all cover the whole list. Lists of 100 rows or fewer look as before. - The Overview's Deliveries column stays readable. It shows at most two Deliveries per Portfolio, then a +N more link to the rest. While loading it shows a spinner, and if the Deliveries cannot be loaded it says so, instead of claiming there are none.
- Deliveries can follow a Jira Release on Jira Server and Data Center too. On a self-hosted Jira the list of Releases to pick from came up empty, so a Delivery could not be bound to one, and nothing said why. Lighthouse now reads Releases the way Jira Server and Data Center (version 8 or later) serve them: the picker lists them, a bound Release's date and Work Items refresh, and the forecast is written back to the Release. Jira Cloud works as before.
- Over-time charts always fill in the days Lighthouse missed. Fill in past days on over-time charts left a Team added last week, or an instance that does not run every day, with a short or gappy trend wherever someone had switched it off. It is no longer a Preview and no longer a setting: Percentiles Over Time and PBC Over Time fill in past days on every instance, including ones where it had been switched off. Filled days cannot be told apart from recorded ones afterwards, so take a backup before you upgrade if you might want your unfilled history back. Full detail: Filling in past days.
- Jira status changes keep their real time on every server. On a Lighthouse server that does not run in UTC, the moments a Jira Work Item or Feature changed status, and the day it was created, were stored shifted by the server's offset, so a change made late in the evening could count on the next day and Cycle Time could be a day off. They are now stored as the time Jira names. Times stored earlier are corrected the next time Lighthouse downloads that Work Item or Feature again with its complete history, which happens once it changes in Jira; until then it keeps the times it had. A history entry Jira sends without a readable time no longer stops the whole item from loading.
- Work Items whose Jira links name several issues now land under the right Feature. When the parent comes from an issue link type and a Work Item is also linked the same way to an incident or another issue, Lighthouse used to leave it where it was and only warn. Now only Features count, and among several Features the oldest link wins, then the Feature created first, then the lowest key. Features with several parent links are placed the same way. Every refresh lists what it decided in a warning, and Settings > System Info shows how many records needed it. Full detail: When a Work Item's links name more than one issue.
- A new Additional Field fills in without a manual update. Adding a field to a connection left it empty on every Work Item already in Lighthouse until each Team and Portfolio on that connection had been updated, so a rule on the new field quietly matched nothing. Saving a change to a connection's Additional Fields now offers to update its Teams and Portfolios straight away, and the field fills in within that update. Full detail: Additional Fields.
Contributions ❤️
Special thanks to everyone who contributed feedback for this release:
Lighthouse v26.10.10.1
Support for Team-Level Refinement
Most Teams refine by habit: an hour every week, whatever is on top of the backlog, until the time runs out. Some weeks that leaves the Team starving for ready work; other weeks it builds a queue of refined Work Items that sit and go stale.
Every Team now has a Refinement tab. It lists the Work Items in the Team's refinement states, in backlog order, and answers two questions before the next Refinement.
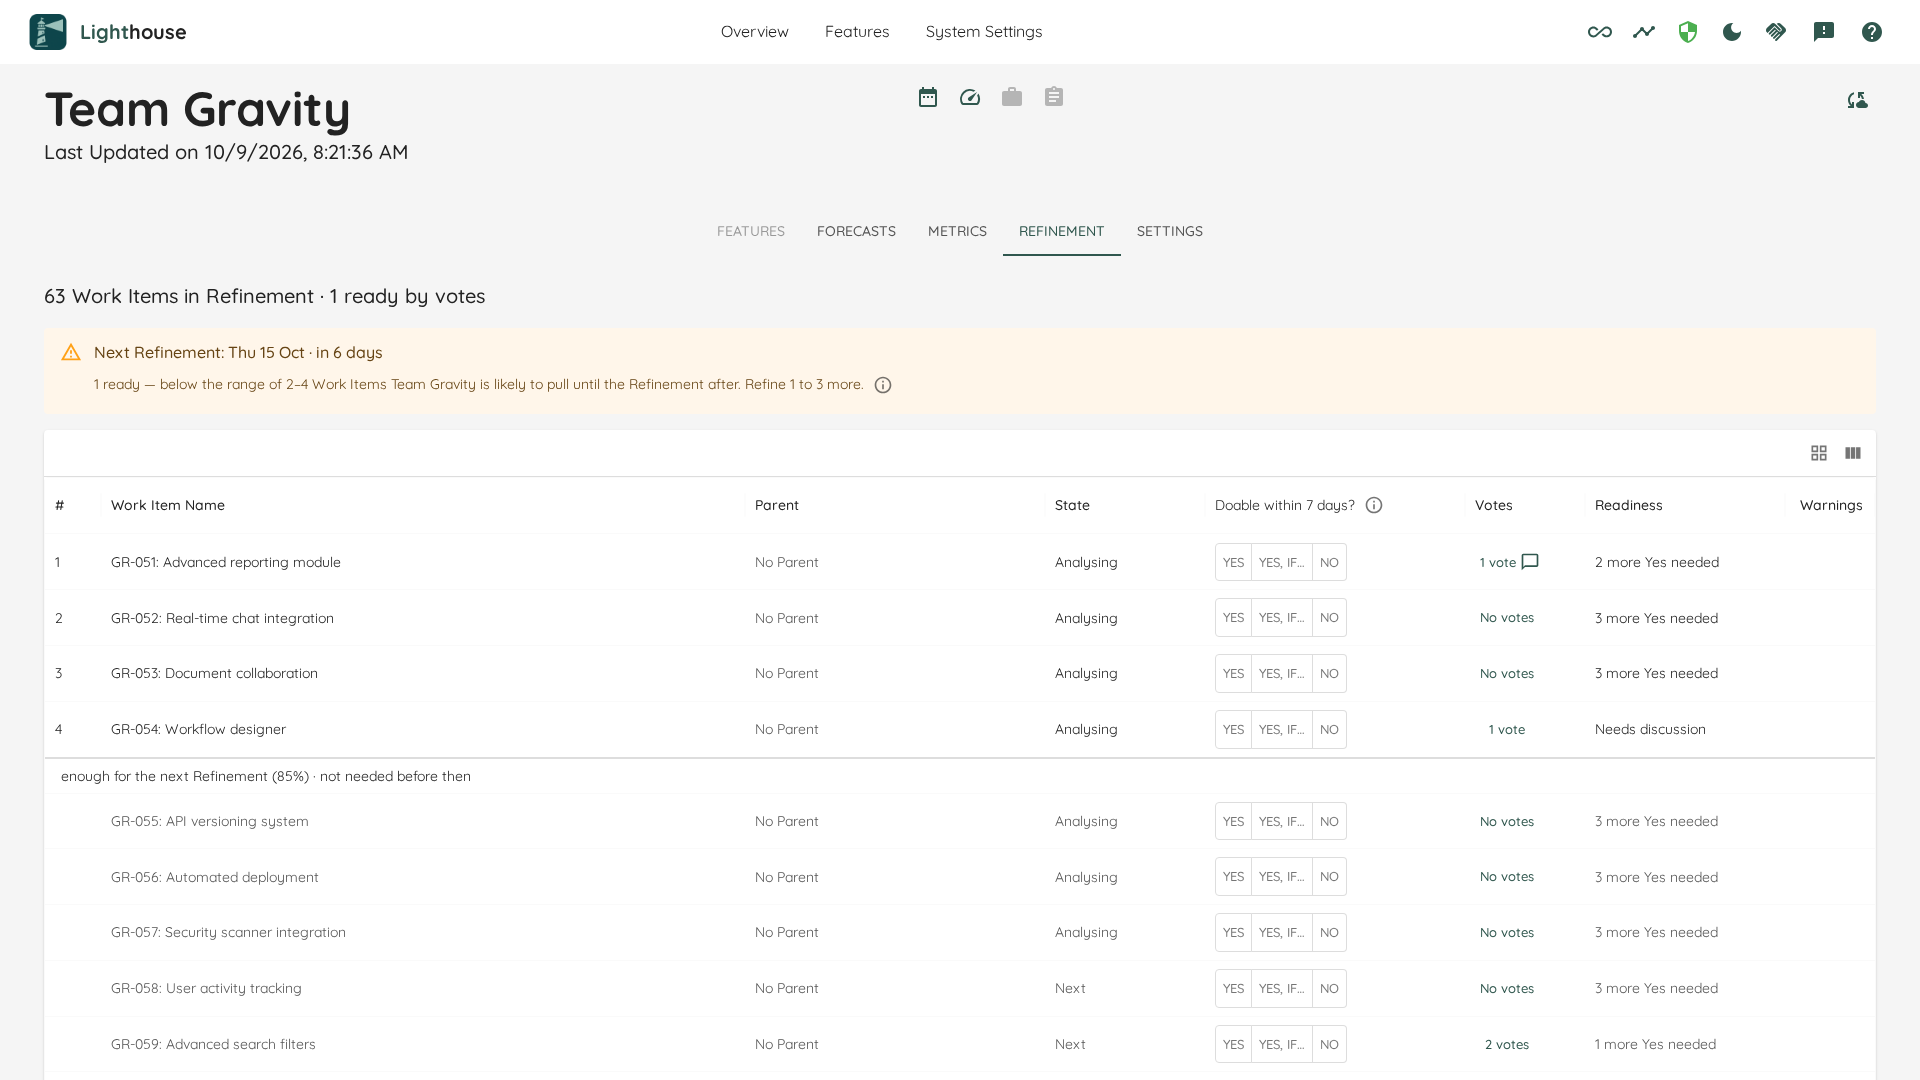
How much should we refine? Give the Team a Refinement cadence, and Lighthouse compares how many Work Items are ready with how many the Team is likely to pull until the Refinement after the next one, using the same How Many forecast as the Forecasts tab. The answer is one of three: refine 2 to 5 more, nothing more is needed, or stop refining. The Work Items needed first are numbered, and a line shows where "enough" ends. Having too much ready is flagged as clearly as having too little.
Is this Work Item small enough? Instead of estimating, everybody votes on one question: is this doable within our SLE? The answers are Yes, Yes, if… (with the condition written down) or No. Votes can be cast at any time and without a meeting, and enough Yes votes make a Work Item Ready. If your work tracking system already tracks readiness, stage rules let it decide, and the votes sit beside it as a second opinion.
Refinement is part of every Lighthouse installation, community and premium. Full detail: Refinement and Refinement settings.
Reworked Agent Skills
The Lighthouse skill has been reworked, and two new skills join it, each walking your AI assistant through one recurring Team routine:
- Refinement gets a Team ready for its next Refinement: whether to refine more or stop, and which Work Items are worth the session's time. Try: "Are we ready for Thursday's Refinement?"
- Daily Flow Review opens a Team's daily with what to discuss today: Work Items that are blocked, past the SLE or at risk of missing it, and WIP over its limit. Try: "What should Gravity discuss today?"
Both new skills grew out of ideas from Liz Rettig. Each skill is its own download. Full detail: AI Integration.
Bugfixes and Improvements
- Each chart widget now shows a loading indication while its data is refreshed, and says so when its data cannot be loaded, instead of showing the old answer or an empty chart.
- Parents from Jira issue links now work for Work Items that are both a child and a parent. If you set a one-way phrase like is caused by, type the phrase the child uses to point at its parent, or the link type's name. Full detail: Parent Override Field.
- Usage data from the CLI and MCP.
lhand the MCP servers now ask for consent to share usage data, just as the browser does, and report the same events once you agree. Each event is labelled with where it came from. Nothing personal is sent. Full detail: Usage Data. - Updated various third-party libraries.
Contributions ❤️
Special thanks to everyone who contributed feedback for this release:
Lighthouse v26.10.3.6
Forecast Reality Check
A backtest answers "would this one forecast have held?". It cannot tell you whether a Team's forecasts hold in general, or whether the sampling window behind them is a good one — and that is the question that decides how much weight a forecast can carry.
On a Team's Forecasts tab, press the new Run reality check below the backtest inputs. Lighthouse replays the Team's recent forecasts — horizons of 1, 2, 4 and 8 weeks, each forecast from 14, 30, 60 and 90 days of history plus your own setting — and holds every one at 50%, 70%, 85% and 95% against the Work Items the Team actually completed.
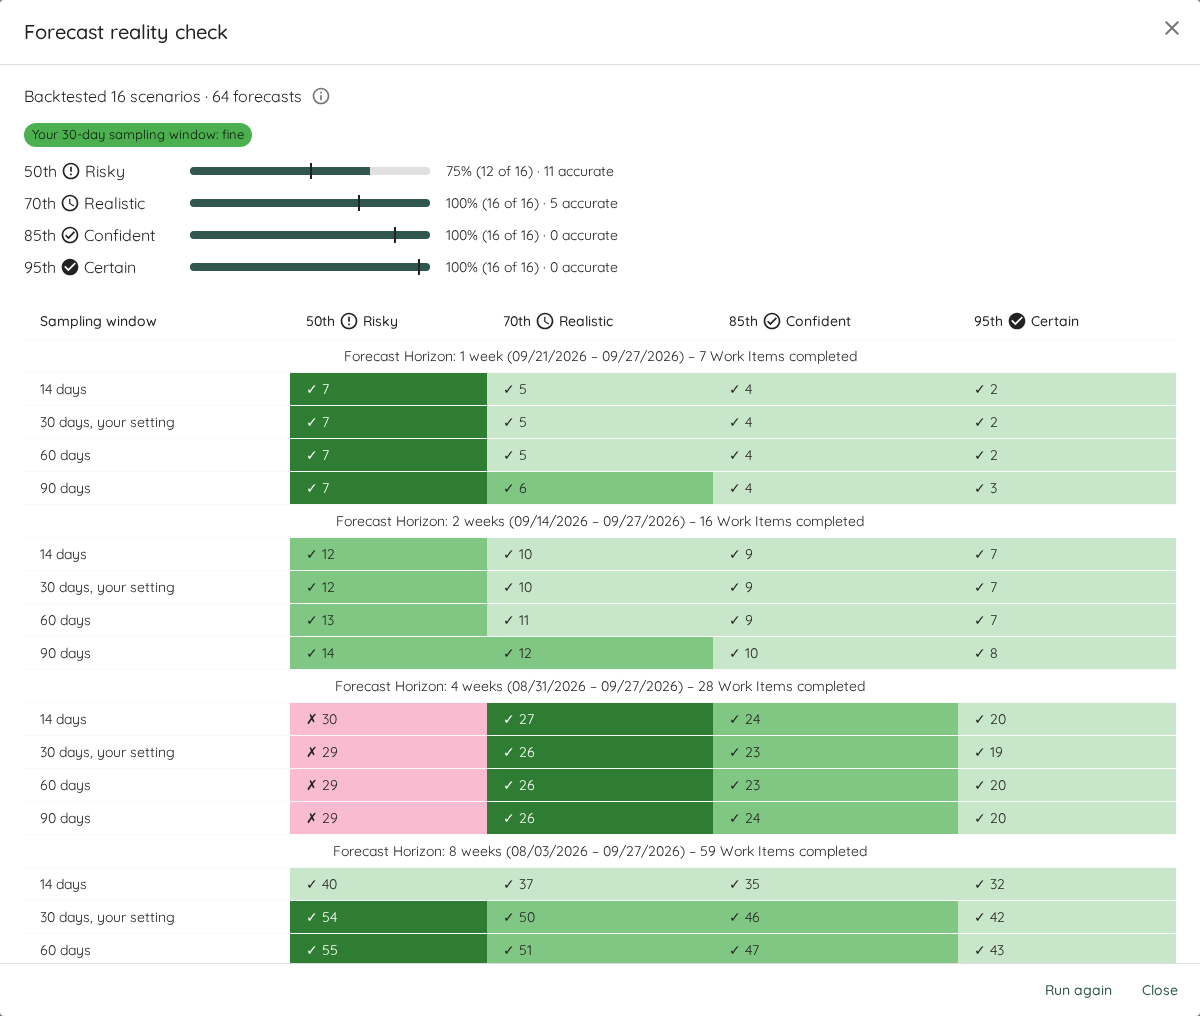
The answer opens on a summary: whether your sampling window held up, how often each confidence level held against the rate it should hold at, and how many forecasts landed within 10% of what was delivered. Below it, every forecast sits beside the actual, shaded by how close it came.
The method follows Nick Brown's article The Full Monte. Full detail: Forecast Reality Check.
Filling in Past Days is now On by Default
The Fill in past days on over-time charts behaviour setting from the last release is now switched on by default, so Percentiles Over Time and PBC Over Time show a full line rather than only the days Lighthouse happened to record.
Upgrading switches it on once — also on instances where it had been turned off. If you want it off, switch it off again under Behaviour Settings and it stays off from then on. Restoring a backup brings the setting back as the backup held it. It is still a Preview. Full detail: Fill in past days.
Bugfixes and Improvements
- Adding a Data Sync Mapping for a new field works again. The mapping and the field it targets are now saved together, instead of failing on the first save.
- New Teams and Portfolios get the same defaults everywhere. A Team created through the API started with 30 days of throughput history while the UI used 90; both now use 90. A Portfolio saved with a percentile history of 0 now falls back to 90 days as well.
- The Helm chart now runs PostgreSQL 18 and upgrades the bundled database for you. On
helm upgrade, the bundled Postgres carries its data from 17 to 18 before it starts, and keeps the old copy so you can roll back. Full detail: Upgrading the bundled PostgreSQL. - Updated various third-party libraries.
Contributions ❤️
Special thanks to everyone who contributed feedback for this release:
Lighthouse v26.9.24.6
Delivery Timeline
A forecast tells you when a Delivery will be done. It did not show you how it gets there — which Features get worked first, which ones sit in the queue behind them, and where the target date falls in all of that.
Expand a Delivery and open its new Timeline tab: one bar per Feature, in board order, running from the day work on it is forecast to begin to the day it is forecast to finish. Switch between 70%, 85% and 95% and both ends of every bar move together, so each bar is always one consistent scenario. Switching to 95% and checking whether the last bar still lands before your target date is the quickest read on how much slack you really have.
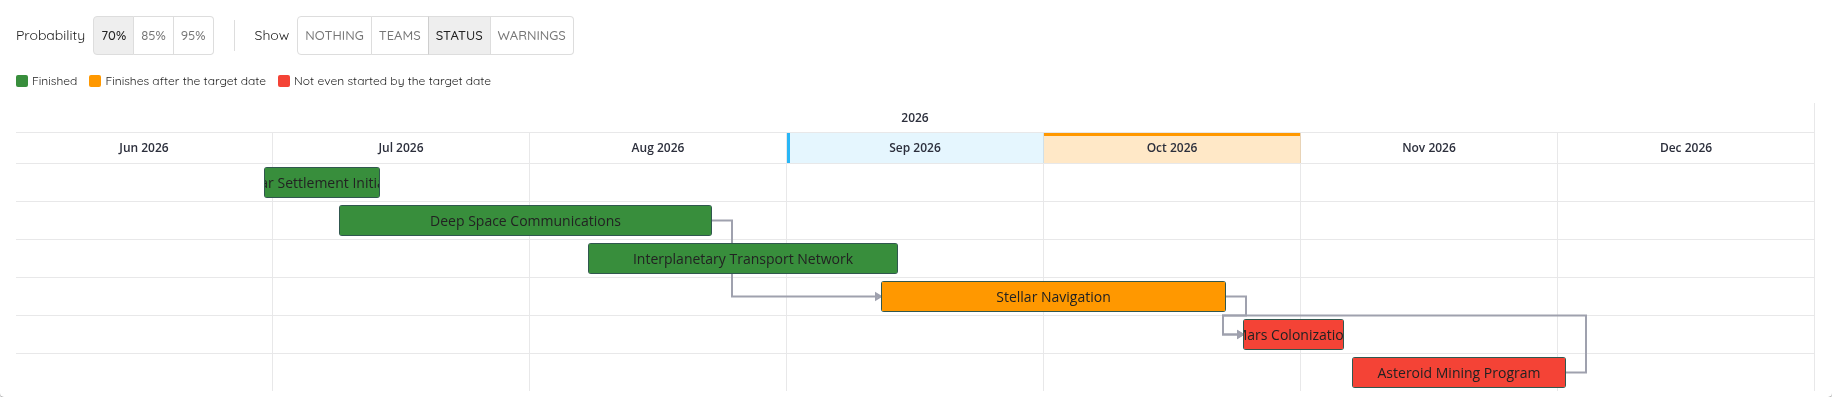
The bars can answer one more question at a time:
- Status — which Features finish after the target date, and which ones will not even have started by then.
- Teams — a Feature worked by several Teams splits into a row per Team, each with its own dates.
- Warnings — the same warnings the Features table shows, right on the bar.
Where a Feature waits on another and the forecast took that into account, a line joins the two bars. Waits the forecast could not honour are spelled out on the bar instead of drawn. Features that cannot be placed are listed beneath the chart with the reason, never silently left out.
The Timeline is a premium feature. Full detail: Delivery Timeline.
Forecasted Start Dates
Lighthouse has always forecast when a Feature will be done. Now it also forecasts when work on it will begin.
The new Forecasted Start column sits beside the completion forecast, with the same four probabilities, from the same simulation. A start date far out is Lighthouse telling you about the queue: nothing starts until the Teams working it are free of everything ordered above it. A Feature that has already started shows the day it actually started — a date that has happened is a fact, and no probability moves it.
The column appears wherever Features are listed and needs no licence. Just like the completion dates, the start dates can be written back to Jira and Azure DevOps through Data Sync Mappings, so your plans in the tracker show both ends of every Feature.
Full detail: Forecasted Start.
Fill in Past Days on Over-Time Charts (Preview)
Percentiles Over Time and PBC Over Time only ever showed the days Lighthouse happened to record. A Team added last week, or an instance that does not run every day, got a short line or one full of holes — even though the Work Items needed to work out those days were already stored.
Switch on the new Fill in past days on over-time charts behaviour setting, and opening either chart works out the missing days in the background from the history Lighthouse already keeps. A day nothing can be worked out for stays empty — nothing is invented to fill it.
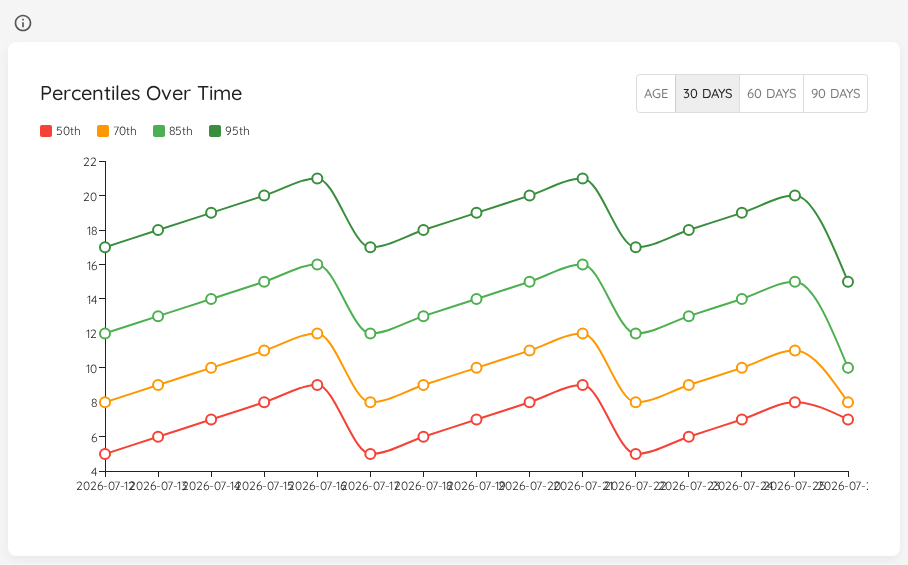
It is a Preview and off by default — a System Admin switches it on, no restart needed. A filled day is worked out against today's configuration, and days already filled stay when you switch it off, so take a backup first if you might want to undo it.
Full detail: Fill in past days.
Bugfixes and Improvements
- Faster Updates is no longer a switch. Every refresh that can download only what changed now does, on every instance. An instance that had it turned off gets the faster refresh too.
- The SLE Risk tooltip says how much of the evidence missed the SLE, and the risk column takes its target from the Team's SLE.
- The Task Manager's activity rows lead with the work rather than the Team or Portfolio, and a queued row no longer names itself as the thing it is waiting for.
- No more Kestrel warning at startup about the listening address being set twice.
- Updated various third-party libraries.
Contributions ❤️
Special thanks to everyone who contributed feedback for this release:
Lighthouse v26.9.19.10
Display Risk of Missing your Service Level Expectation
An aging chart tells you how old an item is. It does not tell you whether its age is a problem.
Lighthouse now puts a number on it. Every in-progress Work Item carries the chance it will finish later than its Team's SLE, derived from that Team's own cycle time history.
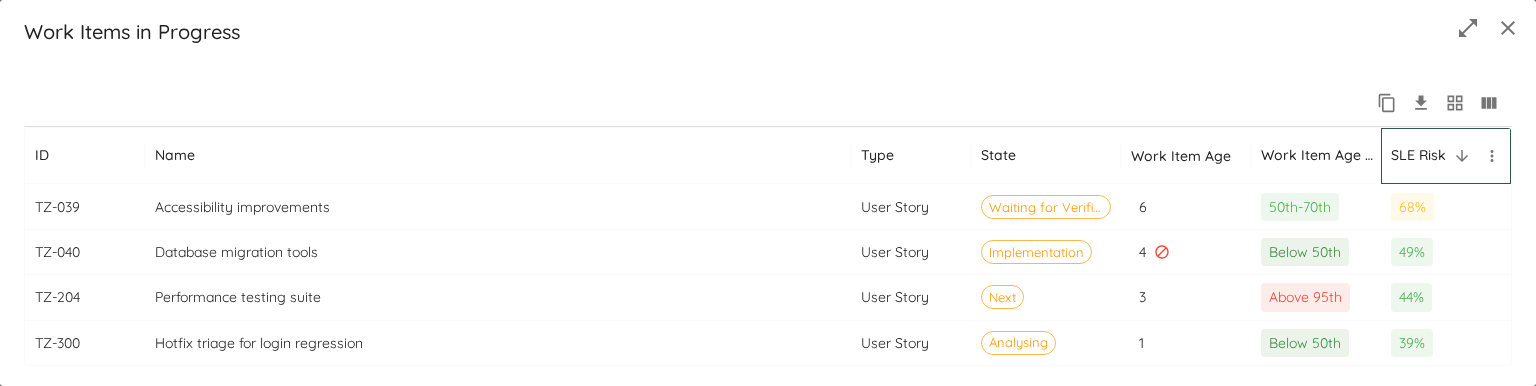
As an example, let's assume your SLE is 5 days at 80%. Your relevant history includes 45 items that were closed. You want to know the risk of breaching your SLE for an item that is right now 3 days old.
Of your historical 45 items, 20 items had a Cycle Time of 3 days or more. 8 of those were breaching the SLE (Cycle Time of 6+ days). That means, for your current item, the risk is: (100 / 20) * 8 = 40%
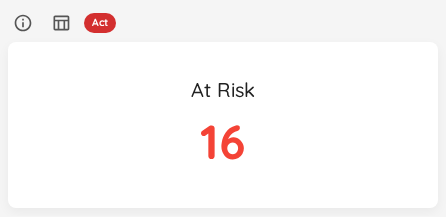
The number can be seen in the Work Items Dialog for in Progress Items, as well as in a new widget that shows you all the "At Risk" items currently in progress. At risk means that there is a 70+ percent chance that you breach the SLE.
Full detail: Flow Metrics.
Task Manager
"Is Lighthouse doing anything right now?" had no good answer. A refresh that hung, a connection whose credential quietly expired, an error that scrolled past in the log — all of it invisible unless you went digging.
Now you can watch what Lighthouse is up to when you click on the timeline icon in the header: what is refreshing and what is queued, the health of every connection to your Work Tracking Systems, and what has gone wrong recently.
You can also stop a refresh, which was not possible from the UI before — every connector now notices the stop mid-page rather than finishing the fetch anyway.
It names every Team, Portfolio and connection on the instance, so it is shown to System Administrators only.
Full detail: Task Manager.
Parents read from Jira issue links
Some Jira instances do not record hierarchy as a parent field at all. They record it as an issue link — "caused by", "results in", etc.
You can now define additional fields that point to those "link types", and use them as "Parent Overrides" for your Teams and Portfolios.
This allows Lighthouse to set up Portfolios with Features and proper forecasting, even if you don't use any built-in Parent-Child connection on your Jira instance.
Jira only, Data Center and Cloud, and free — no licence needed. Full detail: Team settings and Portfolio settings.
Usage Data Collection
Up until now, we used to have no indication who and how Lighthouse is used. The nature of the tool, allowing to self-host and all made it tricky. We understand that not everyone wants to send their usage data, and that's completely ok. However, some people may be ok with that. And it would be of great help to us.
So we introduced a strictly opt-in feature that enables sending of some data points. If enabled, Lighthouse can now tell us which parts of it get used, plus a little about the instance doing the using: its version, how it is deployed, which licence tier it runs on.
To repeat, nothing is sent until somebody using that instance agrees to it, and anyone can stop it again with one click.
We don't send any info about your work items, team names etc., but only basic information about your instance as well as what you are using. You can see the full details in the docs below.
Important: If you are using a premium license, a system administrator can disable any usage data sending for the full instance. This will prevent sending data for anyone that uses this instance, independent of their individual answer.
Full detail: Usage Data.
Lighthouse is now source available
This is the first release under the Lighthouse Source Available License 1.0. The source stays public on GitHub: you can read it, run it, audit it and change it for your own use, but it is no longer MIT.
Everything up to and including v26.9.9.9 remains MIT licensed in perpetuity. That is not retroactive: if you run one of those versions, or hold a copy or a fork, your rights are untouched.
For almost everyone, nothing changes. Running Lighthouse inside your company for as many people as you like, modifying it heavily, forking it, building plugins or dashboards on top of it, and consulting or coaching with it all stay permitted. What is not permitted is offering Lighthouse as a hosted or managed service to other people, removing or bypassing the licence key check, and building a separate product out of the source whose primary purpose is to replace Lighthouse.
Publishing the source is how we let you verify that your delivery data stays on your own infrastructure, and we want to keep doing that. What we did not intend was to hand someone a complete forecasting product to resell, or to make the paid tier trivially removable. There is a free Community edition, and there always will be.
Full detail: Licensing.
Bugfixes and Improvements
- Team creation failed validation on Jira Data Center. Selecting a board could fail with a bare 400. The query had outgrown what fits in a request line — Lighthouse now asks Data Center for issues over POST.
- A Portfolio refresh could fail with a 400 that said nothing. Lighthouse now reports what Jira actually said, and names the query it sent when Jira will not say what was wrong. A configuration that narrows nothing gets no query rather than an empty one, and board filters and sub-filters are bracketed independently.
- A mistyped additional field killed every refresh on Jira Data Center. An unresolvable field reference now names the field it could not find, pinned to the Additional Fields input, instead of throwing an unexpected error.
- Azure DevOps blamed the wrong thing for a refused field list. A field-metadata lookup that fails now says so, instead of reporting an unreachable URL or a bad token — and fields that cannot be resolved are no longer dropped in silence.
- A failed connection validation hid what Lighthouse already knew. The verdict now carries what the connector itself said.
- The log viewer opens at the tail. It opened at the top, which is the wrong end of a log when you are looking for what just went wrong.
- Updated various third-party libraries.
Contributions ❤️
Special thanks to everyone who contributed feedback for this release:
Lighthouse v26.9.9.9
Named time ranges, and stepping the metrics window
Every metrics dashboard opened on a range you had to set with two date pickers, one end at a time. Click the date range in the header and there is now a row of named ranges — 7, 14, 30 or 90 days for a Team, 30, 90 or 180 for a Portfolio — that jump straight to a window ending today.
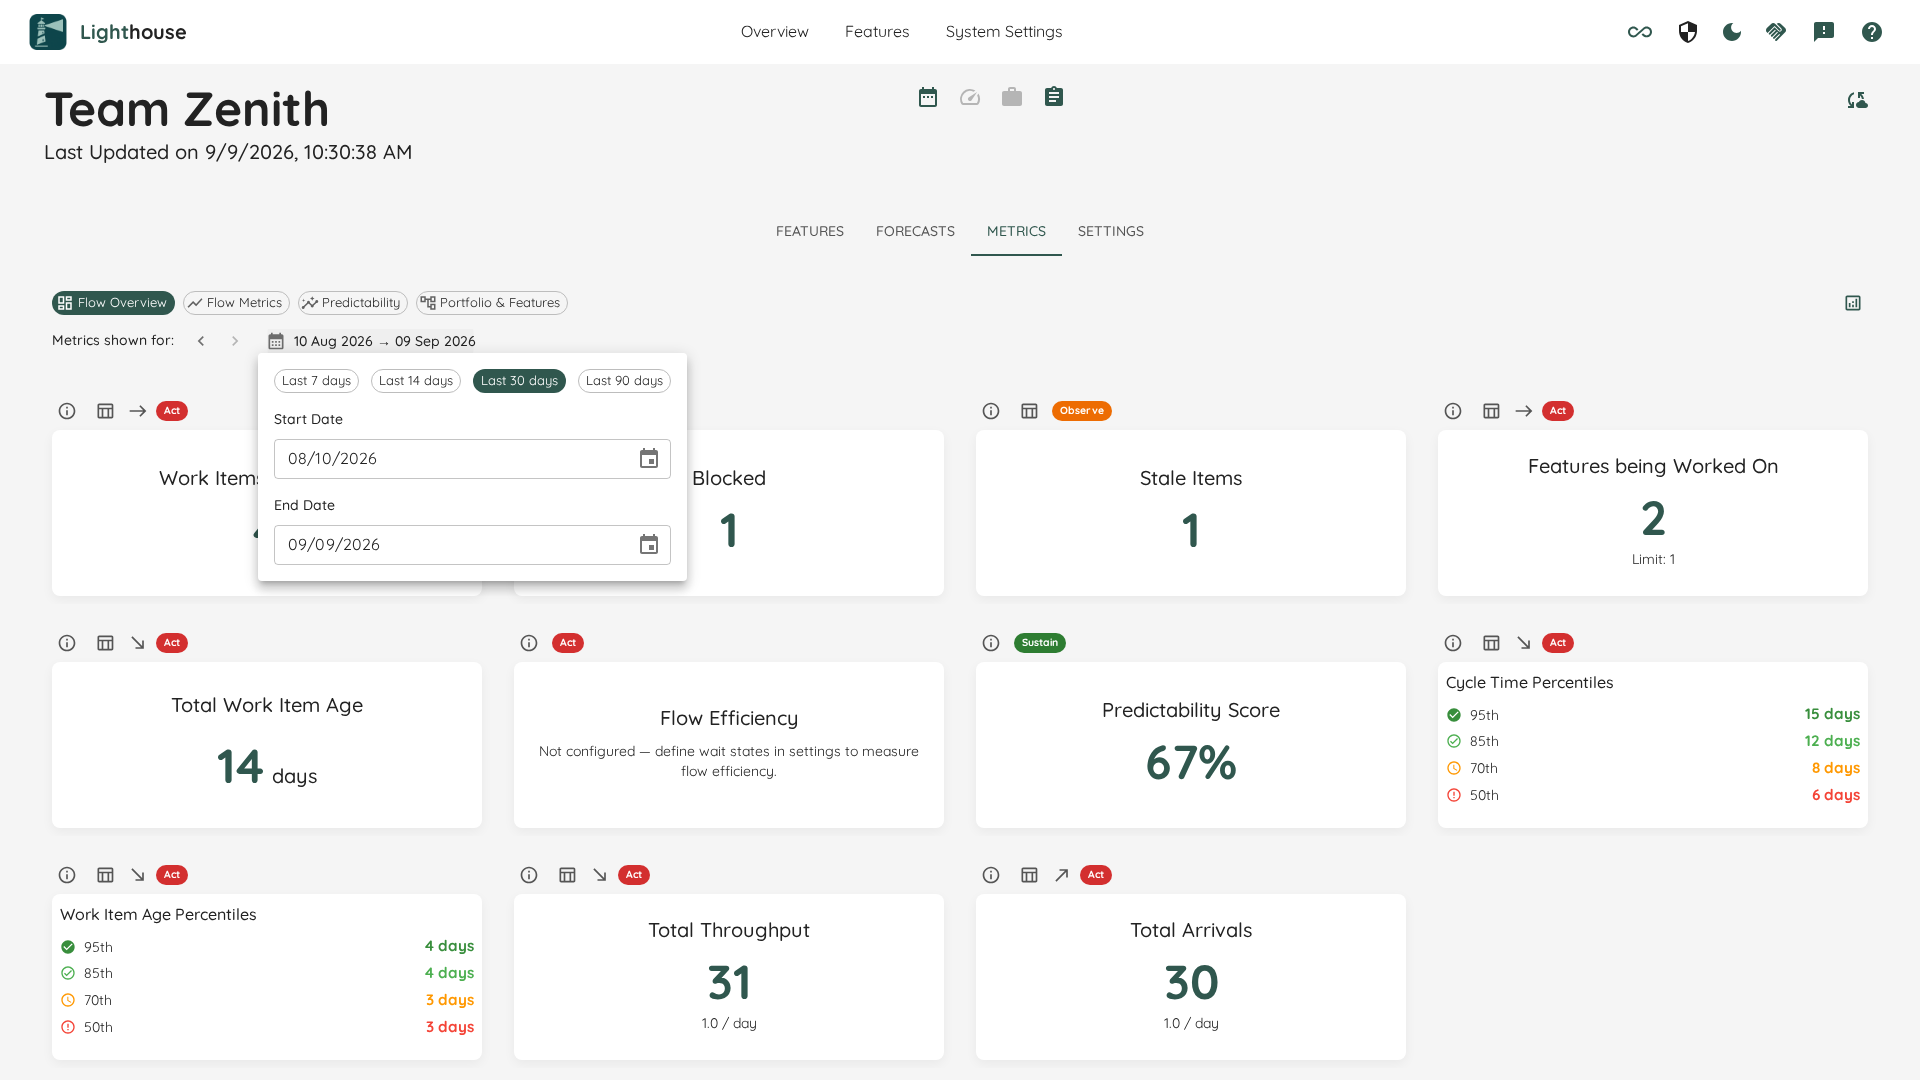
Either side of the date range sit two arrows that walk the window you already have backwards and forwards, keeping its length: a week at a time for a Team, four weeks for a Portfolio. That is how you compare the same span of time across consecutive periods without doing the arithmetic yourself. Click them several times in a row and Lighthouse waits until you stop before it reloads, so six steps cost one fetch rather than six.
Full detail: Filtering.
Work Item Age bands in the work item dialog
The Work Item Aging chart already paints a coloured pace zone behind every dot: how this item's age compares against how long finished Work Items historically took to leave the state it is sitting in. Reading that meant going dot by dot.
It is now a value on a row. Open the work item dialog from View Data or by clicking a bubble, and each row carries a Work Item Age Band — Below 50th, 50th-70th, 70th-85th, 85th-95th, Above 95th, or No history where the state has nothing to be measured against. Sort worst-band-first, cut the list to a single band with the column filter, or export it as a CSV whose band column reads in words.
The bands are per state rather than per total age, so an item three days into a state everything else leaves in one reads worse than an item that has been in progress a fortnight and is exactly where it should be.
Full detail: Work Item Age Band Column.
Behaviour Settings
Instance-wide switches were spread out: Optional Features in one place, Feature Ordering in a section of its own. They now sit in one table under Settings → Behaviour Settings, a row per switch, each saying what it does and — where it applies — which licence unlocks it.

Feature Ordering moved in as one of those rows, and your existing choice came with it. Turning it on still hands out places to the Features that do not have one yet and re-forecasts; turning it off still leaves those places alone, so taking the order back over adds to the end instead of renumbering everything.
Full detail: Behaviour Settings.
Faster Updates is on by default
Faster Updates — the two-phase refresh that sweeps your query for what actually changed and downloads only that — is out of preview. New instances start with it on. Existing instances keep whatever you had, and the switch is still there, now as one of the Behaviour Settings rows.
Bugfixes and Improvements
- The metrics date pickers no longer crash on a half-typed date — typing a
0into the day or the month dropped the dashboard onto an error screen. A date is now applied only once it is complete and valid, which also means typing your way through a date no longer reloads the widgets on every keystroke. - Updated various third-party libraries.
Contributions ❤️
Special thanks to everyone who contributed feedback for this release:
Lighthouse v26.9.1.6
Fixed: updating from inside Lighthouse could leave it unable to start
A Windows or Linux server binary updated to v26.8.31.7 from inside Lighthouse could fail to start, exiting with:
FATAL: The encryption key supplied by EncryptionSettings__EncryptionKey is the key
published with Lighthouse. [...] Lighthouse will not start on it.
Nothing was lost — the instance stopped before changing anything, and every stored credential is still readable. Lighthouse now ignores that leftover key and keeps one of its own instead.
Already stuck? You do not need this release to recover. Delete the EncryptionSettings block from the appsettings.json next to Lighthouse.exe, start Lighthouse again, then press Move stored secrets under Settings → Encryption. Do not copy that value into Encryption__Key.
Docker, Kubernetes and macOS were never affected.