Repository navigation
feat(metrics): chart one line per series by default with operation chips - #113473
Conversation


|
😎 Merged successfully - details. |

|
Important Review skippedWe couldn't safely recover the incremental review. No full review was started, and the last reviewed checkpoint was preserved. Retry later, or explicitly request a full review by commenting You can disable this status message by setting the Use the checkbox below for a quick retry:
📝 WalkthroughWalkthroughMetrics queries can now return separate physical series without aggregation, with a 100-series cap, and can apply rate or increase transformations per series. The metrics viewer adds controls and state for these operations, supports legacy rate and increase query values, and displays a notice when the raw-series cap is reached. The Metrics scene replaces the Explore catalog tab with Overview and removes the catalog UI and logic. 🚥 Pre-merge checks | ❌ 1❌ Failed checks (1 warning)
Full details: Description checkExplanation The description includes all required sections and gives clear user-facing changes, testing details, screenshots, release status, docs status, and agent context. However, its testing section claims full viewer validation against a local stack, including the series-cap banner, while the provided objectives state that this was not tested. This creates a material accuracy issue in the required test report. Resolution Reconcile the testing section with the actual test evidence. Remove unsupported claims about full-viewer and series-cap-banner validation, or provide the missing test evidence. State any untested behavior explicitly and retain only automated tests and manual checks that were actually performed. ✨ Finishing Touches 💡 1⚔️ Resolve merge conflicts 💡
📝 Generate docstrings
🧪 Generate unit tests (beta)
Comment |

![coderabbitai[bot]](https://avatars.githubusercontent.com/in/347564?s=60&v=4)

There was a problem hiding this comment.
Note
Quiet mode is enabled, so only the most important comments were posted inline. Other review comments are grouped below.
🟡 Other comments (3)
products/metrics/frontend/components/MetricsOperations.tsx (1)
68-84: 🎯 Functional Correctness | 🟡 Minor | ⚡ Quick winThe chip's remove
sideActionignoresdisabledReason.
LemonButtondisables only the main button whendisabledReasonis set. ThesideActiongets no disabled state. A user without viewer access can still click the X, which callsonRangeFunctionChange(null)oronAggregationChange(null)and changes the query. PassdisabledReasonto the side action as well.🐛 Fix
                 sideAction={{
                     icon: <IconX />,
                     onClick: onRemove,
                     tooltip: removeTooltip,
+                    disabledReason: disabledReason ?? undefined,
                     'data-attr': `${dataAttr}-remove`,
                 }}
products/metrics/frontend/components/MetricsStarterDashboardModal.tsx (1)
84-84: 🎯 Functional Correctness | 🟡 Minor | ⚡ Quick winTwo picker options can now have the same label.
When a name exists as more than one OTel type, the keys stay different but both options read the same. The user cannot tell which type each option selects. Show the type only for names that appear more than once.
products/metrics/backend/facade/api.py (1)
365-373: 🎯 Functional Correctness | 🟡 Minor | ⚡ Quick winRaw series sharing all labels collapse to identical legends.
_drop_shared_labelsremoves every label that has the same value on all series. Two physical series can differ only inservice_nameormetric_type, or have identical label maps. In either case every series ends withlabels={}. Line 146 keeps the series apart byseries_key, but the response contains several unlabeled lines that the user cannot tell apart. Keep at least one distinguishing key, or skip the drop when it would empty every label set. The_labels_by_fingerprintquery also omitsservice_name, so a per-service split cannot be shown.
🧹 Nitpick comments (2)
products/metrics/frontend/components/MetricNameFilter.tsx (1)
94-98: 🚀 Performance & Scalability | 🔵 Trivial | 💤 Low valueThe dedupe is O(n²), and it hides same-name metrics that have a different type.
findIndexruns once for each item. With 100 items this is cheap. The real cost is behavioral. The PR says the type stays as a hidden pin, butsetMetricNamelatches the type of the firstitemsmatch. A user cannot pick the other type of a name that exists as more than one type. If that is intended, no change is needed. To make the dedupe linear, use aSet:♻️ Linear dedupe
-        () => pickerItems.filter((item, index) => pickerItems.findIndex((other) => other.name === item.name) === index),
+        () => {
+            const seen = new Set<string>()
+            return pickerItems.filter((item) => !seen.has(item.name) && (seen.add(item.name), true))
+        },
products/metrics/backend/presentation/api.py (1)
127-127: 🩺 Stability & Availability | 🔵 Trivial | ⚡ Quick winValidate invalid metric clause combinations in the serializer.
The query action catches
ValueErrorfrom_build_clauseand raisesParseError, so these combinations do not produce a 500 response. The serializer still accepts them and rejects them only during clause construction. Add serializer validation foraggregation="none"withgroupBy, and forrangeFunctionwithaggregation="rate"or"increase", so clients receive a structured field-level validation error.
ℹ️ Review info
⚙️ Run configuration
- Configuration used: Repository: PostHog/posthog/.coderabbit.yaml
- Review profile: QUIET
- Plan: Enterprise
- Run ID:
24fee9b8-49e7-4853-855e-663f195cefd1
⛔ Files ignored due to path filters (3)
products/metrics/frontend/generated/api.schemas.tsis excluded by!**/generated/**products/metrics/frontend/generated/api.zod.tsis excluded by!**/generated/**services/mcp/src/generated/metrics/api.tsis excluded by!**/generated/**
📒 Files selected for processing (36)
frontend/src/queries/schema.jsonfrontend/src/queries/schema/schema-general.tsposthog/schema.pyposthog/schema_enums.pyposthog/settings/web.pyproducts/metrics/backend/facade/api.pyproducts/metrics/backend/facade/contracts.pyproducts/metrics/backend/facade/enums.pyproducts/metrics/backend/hogql_queries/metrics_query_runner.pyproducts/metrics/backend/metric_query_runner.pyproducts/metrics/backend/metric_samples_query_runner.pyproducts/metrics/backend/presentation/api.pyproducts/metrics/backend/tests/test_metric_query_runner.pyproducts/metrics/frontend/MetricsScene.tsxproducts/metrics/frontend/components/MetricNameFilter.tsxproducts/metrics/frontend/components/MetricsCatalog.stories.tsxproducts/metrics/frontend/components/MetricsCatalog.test.tsxproducts/metrics/frontend/components/MetricsCatalog.tsxproducts/metrics/frontend/components/MetricsClauseRow.tsxproducts/metrics/frontend/components/MetricsFundamentals.tsxproducts/metrics/frontend/components/MetricsOperations.tsxproducts/metrics/frontend/components/MetricsStarterDashboardModal.tsxproducts/metrics/frontend/components/MetricsViewer.tsxproducts/metrics/frontend/components/metricsCatalogLogic.test.tsproducts/metrics/frontend/components/metricsCatalogLogic.tsxproducts/metrics/frontend/components/metricsFundamentalsLogic.tsxproducts/metrics/frontend/components/metricsHandoff.test.tsproducts/metrics/frontend/components/metricsStarterDashboardLogic.test.tsproducts/metrics/frontend/components/metricsStarterDashboardLogic.tsxproducts/metrics/frontend/components/metricsUsageTrackingLogic.test.tsproducts/metrics/frontend/components/metricsUsageTrackingLogic.tsproducts/metrics/frontend/components/metricsViewerLogic.test.tsproducts/metrics/frontend/components/metricsViewerLogic.tsxproducts/metrics/frontend/metricsSceneLogic.test.tsproducts/metrics/frontend/metricsSceneLogic.tsxservices/mcp/src/api/generated.ts
💤 Files with no reviewable changes (5)
- products/metrics/frontend/components/MetricsCatalog.test.tsx
- products/metrics/frontend/components/metricsCatalogLogic.test.ts
- products/metrics/frontend/components/MetricsCatalog.stories.tsx
- products/metrics/frontend/components/MetricsCatalog.tsx
- products/metrics/frontend/components/metricsCatalogLogic.tsx
Included review availability: This review used your included allowance. Your plan provides up to 12 included reviews per hour; 8 remain after this review.

f8c0dff to
63017c9
Compare

|
Risk: No findings This increment adds a static no-results hint to the metrics query response, primes the metric-name list once on scene mount behind the feature flag, and regenerates schema/type mirrors. The hint is a fixed constant with no user input, the priming fetch is team-scoped and flag-gated, and the generated enum moves are value-identical, so no new security-relevant surface is introduced. Sentinel reviewed |

🤖 CI report
|
| Function | Location | Complexity | Limit |
|---|---|---|---|
applyUrlParams |
products/metrics/frontend/metricsSceneLogic.tsx:284 |
34 | 10 |
MetricsViewer |
products/metrics/frontend/components/MetricsViewer.tsx:94 |
29 | 10 |
parseClausesParam |
products/metrics/frontend/metricsSceneLogic.tsx:96 |
25 | 10 |
propertyFilterToMetricFilter |
products/metrics/frontend/components/metricsViewerLogic.tsx:217 |
13 | 10 |
<anonymous> |
products/metrics/frontend/metricsSceneLogic.tsx:391 |
13 | 10 |
createDashboard |
products/metrics/frontend/components/metricsStarterDashboardLogic.tsx:179 |
11 | 10 |
⚠️ Duplication (Python) — 1 new duplicated block (worst 82 tokens)
New Python code duplication introduced by this branch. Fails at 70+ tokens in app code, or 150+ tokens when both copies live in test files. Advisory while the gate proves itself: extract a shared helper instead of copying.
| First copy | Second copy | Lines | Tokens |
|---|---|---|---|
products/metrics/backend/metric_query_runner.py:476 |
products/metrics/backend/metric_samples_query_runner.py:25 |
13 | 82 |
✅ Duplication (TypeScript) — clean
New TypeScript code duplication introduced by this branch. Fails at 70+ tokens in app code, or 150+ tokens when both copies live in test files. Advisory while the gate proves itself: extract a shared helper instead of copying.
⚠️ Comment density — 5% of added code lines are comments (47 of 872)
This section warns when comments are more than 3% of the code lines a PR adds, and alerts above 6%. Before agent-assisted PRs, the typical share was about 2%. Only full-line comments count. Docstrings, generated files, snapshots, migrations, and workflow files are left out.
Comments that restate the code, record how the change came about, or narrate the next line add noise for the next reader. Keep the comments that explain a reason the code cannot show, and remove the rest. See .agents/skills/writing-code-comments/SKILL.md for the house rules.
Files with the most added comment lines:
| File | Comment lines | Added lines |
|---|---|---|
products/metrics/frontend/components/metricsViewerLogic.tsx |
19 | 109 |
products/metrics/frontend/metricsSceneLogic.tsx |
5 | 56 |
frontend/src/queries/schema/schema-general.ts |
3 | 6 |
products/metrics/backend/metric_query_runner.py |
3 | 123 |
products/metrics/frontend/components/metricsStarterDashboardLogic.tsx |
3 | 5 |
posthog/settings/web.py |
2 | 3 |
products/metrics/backend/facade/api.py |
2 | 80 |
products/metrics/frontend/components/MetricsOperations.tsx |
2 | 148 |
This check does not block merging. It updates on every push and clears when the share drops.
✅ Bundle size — 🟢 -3.3 KiB (-0.0%)
Uncompressed size of every built .js bundle, compared against the base branch.
Total: 76.72 MiB · 🟢 -3.3 KiB (-0.0%)
| File | Size | Δ vs base |
|---|---|---|
posthog-app/_parent/products/metrics/frontend/MetricsScene.js |
25.0 KiB | 🟢 -6.6 KiB (-21.0%) |
render-query/src/render-query/render-query.js |
25.65 MiB | 🔺 +2.6 KiB (+0.0%) |
Posted automatically by build-bundle-size-report · uncompressed bytes from dist-report
✅ Eager graph — within budget
How much code each root ships on the eager path — downloaded and parsed before the surface is interactive. Measured from the esbuild output chunks (post-tree-shake, static imports only); lazy import() / React.lazy chunks are not counted.
| Root | Eager (shipped) | Δ vs base | Budget |
|---|---|---|---|
entry (logged-out pages, app bootstrap)src/index.tsx |
1.65 MiB · 23 files | 🟢 -152 B (-0.0%) | █████████░ 89.8% of 1.84 MiB |
logged-out boot: index + App + bootApp (preloaded by every page, including /login)src/index.tsx + src/scenes/App.tsx + src/scenes/bootApp.ts |
3.80 MiB · 675 files | 🟢 -152 B (-0.0%) | █████████░ 94.3% of 4.03 MiB |
authenticated shell (every logged-in page)src/scenes/AuthenticatedShell.tsx |
7.74 MiB · 2,456 files | 🟢 -152 B (-0.0%) | █████████░ 92.8% of 8.34 MiB |
dashboard scenesrc/scenes/dashboard/Dashboard.tsx |
9.97 MiB · 3,536 files | 🔺 +2.0 KiB (+0.0%) | █████████░ 91.3% of 10.92 MiB |
today home pathsrc/scenes/AuthenticatedShell.tsx + src/scenes/project-homepage/ProjectHomepage.tsx + src/scenes/project-homepage/today/TodayHome.tsx |
7.76 MiB · 2,466 files | 🟢 -152 B (-0.0%) | █████████░ 90.4% of 8.58 MiB |
events scenesrc/scenes/activity/explore/EventsScene.tsx |
9.59 MiB · 3,387 files | 🔺 +2.0 KiB (+0.0%) | █████████░ 91.3% of 10.51 MiB |
replay detail scenesrc/scenes/session-recordings/detail/SessionRecordingDetail.tsx |
12.29 MiB · 4,185 files | 🟢 -152 B (-0.0%) | ████████░░ 78.2% of 15.72 MiB |
🟢 node_modules/monaco-editor/ stays out of src/index.tsx
🟢 src/lib/components/ActivityLog/describers stays out of src/index.tsx
🟢 node_modules/@posthog/brand/dist/generated/hoggies/svg/ stays out of src/index.tsx
🟢 node_modules/@posthog/brand/dist/generated/hoggies/components/ stays out of src/index.tsx
🟢 node_modules/monaco-editor/ stays out of src/index.tsx + src/scenes/App.tsx + src/scenes/bootApp.ts
🟢 src/layout/navigation-3000/navigationLogic.tsx stays out of src/index.tsx + src/scenes/App.tsx + src/scenes/bootApp.ts
🟢 src/scenes/dashboard/dashboardLogic.tsx stays out of src/index.tsx + src/scenes/App.tsx + src/scenes/bootApp.ts
🟢 src/lib/lemon-ui/LemonMarkdown/ stays out of src/index.tsx + src/scenes/App.tsx + src/scenes/bootApp.ts
🟢 src/lib/components/RichContentEditor/ stays out of src/index.tsx + src/scenes/App.tsx + src/scenes/bootApp.ts
🟢 src/lib/components/CodeSnippet/ stays out of src/index.tsx + src/scenes/App.tsx + src/scenes/bootApp.ts
🟢 src/taxonomy/core-filter-definitions-by-group.json stays out of src/index.tsx + src/scenes/App.tsx + src/scenes/bootApp.ts
🟢 node_modules/monaco-editor/ stays out of src/scenes/AuthenticatedShell.tsx
🟢 src/lib/components/ActivityLog/describers stays out of src/scenes/AuthenticatedShell.tsx
🟢 products/dashboards/frontend/widgets/previews/ stays out of src/scenes/AuthenticatedShell.tsx
🟢 src/scenes/session-recordings/player/sessionRecordingPlayerLogic.ts stays out of src/scenes/AuthenticatedShell.tsx
🟢 zod/v4/locales/de.js stays out of src/scenes/AuthenticatedShell.tsx
🟢 node_modules/@posthog/brand/dist/generated/hoggies/svg/ stays out of src/scenes/AuthenticatedShell.tsx
🟢 node_modules/@posthog/brand/dist/generated/hoggies/components/ stays out of src/scenes/AuthenticatedShell.tsx
🟢 src/scenes/session-recordings/playlist/SessionRecordingsPlaylist.tsx stays out of src/scenes/dashboard/Dashboard.tsx
🟢 src/scenes/web-analytics/tiles/WebAnalyticsTile.tsx stays out of src/scenes/dashboard/Dashboard.tsx
🟢 src/scenes/project-homepage/ai-first/AiFirstHomepage.tsx stays out of src/scenes/AuthenticatedShell.tsx + src/scenes/project-homepage/ProjectHomepage.tsx + src/scenes/project-homepage/today/TodayHome.tsx
🟢 src/scenes/project-homepage/today/TodayReportPage.tsx stays out of src/scenes/AuthenticatedShell.tsx + src/scenes/project-homepage/ProjectHomepage.tsx + src/scenes/project-homepage/today/TodayHome.tsx
🟢 src/queries/Query/Query.tsx stays out of src/scenes/AuthenticatedShell.tsx + src/scenes/project-homepage/ProjectHomepage.tsx + src/scenes/project-homepage/today/TodayHome.tsx
🟢 src/scenes/session-recordings/playlist/SessionRecordingsPlaylist.tsx stays out of src/scenes/activity/explore/EventsScene.tsx
🟢 src/scenes/web-analytics/tiles/WebAnalyticsTile.tsx stays out of src/scenes/activity/explore/EventsScene.tsx
Largest files eagerly shipped from src/index.tsx
| Size | File |
|---|---|
| 126.8 KiB | ../node_modules/.pnpm/react-dom@18.3.1_react@18.3.1/node_modules/react-dom/cjs/react-dom.production.min.js |
| 24.6 KiB | ../node_modules/.pnpm/buffer@6.0.3/node_modules/buffer/index.js |
| 6.3 KiB | ../node_modules/.pnpm/react@18.3.1/node_modules/react/cjs/react.production.min.js |
| 4.5 KiB | ../node_modules/.pnpm/@jspm+core@2.1.0/node_modules/@jspm/core/nodelibs/browser/process.js |
| 3.9 KiB | ../node_modules/.pnpm/scheduler@0.23.2/node_modules/scheduler/cjs/scheduler.production.min.js |
| 1.4 KiB | ../node_modules/.pnpm/base64-js@1.5.1/node_modules/base64-js/index.js |
| 1.3 KiB | src/index.tsx |
| 1.3 KiB | src/RootErrorBoundary.tsx |
| 912 B | ../node_modules/.pnpm/ieee754@1.2.1/node_modules/ieee754/index.js |
| 839 B | src/scenes/ChunkLoadErrorBoundary.tsx |
Largest files eagerly shipped from src/index.tsx + src/scenes/App.tsx + src/scenes/bootApp.ts
| Size | File |
|---|---|
| 316.7 KiB | ../node_modules/.pnpm/posthog-js@1.438.1_@types+react@18.3.27_react@18.3.1/node_modules/posthog-js/dist/module.mjs |
| 220.8 KiB | ../node_modules/.pnpm/@posthog+icons@0.38.0_react-dom@18.3.1_react@18.3.1__react@18.3.1/node_modules/@posthog/icons/dist/posthog-icons.es.js |
| 126.8 KiB | ../node_modules/.pnpm/react-dom@18.3.1_react@18.3.1/node_modules/react-dom/cjs/react-dom.production.min.js |
| 99.8 KiB | src/lib/api.ts |
| 92.8 KiB | src/products.tsx |
| 69.0 KiB | src/lib/lemon-ui/icons/icons.tsx |
| 40.7 KiB | src/lib/utils/eventUsageLogic.ts |
| 38.7 KiB | ../node_modules/.pnpm/@dnd-kit+core@6.0.8_react-dom@18.3.1_react@18.3.1__react@18.3.1/node_modules/@dnd-kit/core/dist/core.esm.js |
| 33.9 KiB | ../node_modules/.pnpm/kea@4.0.0-pre.6_patch_hash=139b8d1f1304f9d9da452a9a1244c94ea679dbcb85687d8999563146879fb6f5_react@18.3.1/node_modules/kea/lib/index.cjs.js |
| 29.0 KiB | ../node_modules/.pnpm/zod@4.3.6/node_modules/zod/v4/core/schemas.js |
Largest files eagerly shipped from src/scenes/AuthenticatedShell.tsx
| Size | File |
|---|---|
| 316.7 KiB | ../node_modules/.pnpm/posthog-js@1.438.1_@types+react@18.3.27_react@18.3.1/node_modules/posthog-js/dist/module.mjs |
| 281.0 KiB | src/taxonomy/core-filter-definitions-by-group.json |
| 220.8 KiB | ../node_modules/.pnpm/@posthog+icons@0.38.0_react-dom@18.3.1_react@18.3.1__react@18.3.1/node_modules/@posthog/icons/dist/posthog-icons.es.js |
| 153.7 KiB | ../node_modules/.pnpm/re2js@0.4.1/node_modules/re2js/build/index.esm.js |
| 126.8 KiB | ../node_modules/.pnpm/react-dom@18.3.1_react@18.3.1/node_modules/react-dom/cjs/react-dom.production.min.js |
| 112.3 KiB | ../packages/quill/packages/quill/dist/index.js |
| 99.8 KiB | src/lib/api.ts |
| 93.3 KiB | ../node_modules/.pnpm/prosemirror-view@1.40.1/node_modules/prosemirror-view/dist/index.js |
| 92.8 KiB | src/products.tsx |
| 90.6 KiB | ../node_modules/.pnpm/@tiptap+core@3.20.6_@tiptap+pm@3.20.6/node_modules/@tiptap/core/dist/index.js |
Largest files eagerly shipped from src/scenes/dashboard/Dashboard.tsx
| Size | File |
|---|---|
| 316.7 KiB | ../node_modules/.pnpm/posthog-js@1.438.1_@types+react@18.3.27_react@18.3.1/node_modules/posthog-js/dist/module.mjs |
| 281.0 KiB | src/taxonomy/core-filter-definitions-by-group.json |
| 220.8 KiB | ../node_modules/.pnpm/@posthog+icons@0.38.0_react-dom@18.3.1_react@18.3.1__react@18.3.1/node_modules/@posthog/icons/dist/posthog-icons.es.js |
| 181.9 KiB | src/queries/validators.js |
| 153.7 KiB | ../node_modules/.pnpm/re2js@0.4.1/node_modules/re2js/build/index.esm.js |
| 126.8 KiB | ../node_modules/.pnpm/react-dom@18.3.1_react@18.3.1/node_modules/react-dom/cjs/react-dom.production.min.js |
| 112.3 KiB | ../packages/quill/packages/quill/dist/index.js |
| 99.8 KiB | src/lib/api.ts |
| 93.3 KiB | ../node_modules/.pnpm/prosemirror-view@1.40.1/node_modules/prosemirror-view/dist/index.js |
| 92.8 KiB | src/products.tsx |
Largest files eagerly shipped from src/scenes/AuthenticatedShell.tsx + src/scenes/project-homepage/ProjectHomepage.tsx + src/scenes/project-homepage/today/TodayHome.tsx
| Size | File |
|---|---|
| 316.7 KiB | ../node_modules/.pnpm/posthog-js@1.438.1_@types+react@18.3.27_react@18.3.1/node_modules/posthog-js/dist/module.mjs |
| 281.0 KiB | src/taxonomy/core-filter-definitions-by-group.json |
| 220.8 KiB | ../node_modules/.pnpm/@posthog+icons@0.38.0_react-dom@18.3.1_react@18.3.1__react@18.3.1/node_modules/@posthog/icons/dist/posthog-icons.es.js |
| 153.7 KiB | ../node_modules/.pnpm/re2js@0.4.1/node_modules/re2js/build/index.esm.js |
| 126.8 KiB | ../node_modules/.pnpm/react-dom@18.3.1_react@18.3.1/node_modules/react-dom/cjs/react-dom.production.min.js |
| 112.3 KiB | ../packages/quill/packages/quill/dist/index.js |
| 99.8 KiB | src/lib/api.ts |
| 93.3 KiB | ../node_modules/.pnpm/prosemirror-view@1.40.1/node_modules/prosemirror-view/dist/index.js |
| 92.8 KiB | src/products.tsx |
| 90.6 KiB | ../node_modules/.pnpm/@tiptap+core@3.20.6_@tiptap+pm@3.20.6/node_modules/@tiptap/core/dist/index.js |
Largest files eagerly shipped from src/scenes/activity/explore/EventsScene.tsx
| Size | File |
|---|---|
| 316.7 KiB | ../node_modules/.pnpm/posthog-js@1.438.1_@types+react@18.3.27_react@18.3.1/node_modules/posthog-js/dist/module.mjs |
| 281.0 KiB | src/taxonomy/core-filter-definitions-by-group.json |
| 220.8 KiB | ../node_modules/.pnpm/@posthog+icons@0.38.0_react-dom@18.3.1_react@18.3.1__react@18.3.1/node_modules/@posthog/icons/dist/posthog-icons.es.js |
| 181.9 KiB | src/queries/validators.js |
| 153.7 KiB | ../node_modules/.pnpm/re2js@0.4.1/node_modules/re2js/build/index.esm.js |
| 126.8 KiB | ../node_modules/.pnpm/react-dom@18.3.1_react@18.3.1/node_modules/react-dom/cjs/react-dom.production.min.js |
| 112.3 KiB | ../packages/quill/packages/quill/dist/index.js |
| 99.8 KiB | src/lib/api.ts |
| 93.3 KiB | ../node_modules/.pnpm/prosemirror-view@1.40.1/node_modules/prosemirror-view/dist/index.js |
| 92.8 KiB | src/products.tsx |
Largest files eagerly shipped from src/scenes/session-recordings/detail/SessionRecordingDetail.tsx
| Size | File |
|---|---|
| 316.7 KiB | ../node_modules/.pnpm/posthog-js@1.438.1_@types+react@18.3.27_react@18.3.1/node_modules/posthog-js/dist/module.mjs |
| 316.0 KiB | ../node_modules/.pnpm/posthog-js@1.438.1_@types+react@18.3.27_react@18.3.1/node_modules/posthog-js/dist/rrweb.js |
| 281.0 KiB | src/taxonomy/core-filter-definitions-by-group.json |
| 220.8 KiB | ../node_modules/.pnpm/@posthog+icons@0.38.0_react-dom@18.3.1_react@18.3.1__react@18.3.1/node_modules/@posthog/icons/dist/posthog-icons.es.js |
| 181.9 KiB | src/queries/validators.js |
| 153.7 KiB | ../node_modules/.pnpm/re2js@0.4.1/node_modules/re2js/build/index.esm.js |
| 126.8 KiB | ../node_modules/.pnpm/react-dom@18.3.1_react@18.3.1/node_modules/react-dom/cjs/react-dom.production.min.js |
| 112.3 KiB | ../packages/quill/packages/quill/dist/index.js |
| 99.8 KiB | src/lib/api.ts |
| 93.3 KiB | ../node_modules/.pnpm/prosemirror-view@1.40.1/node_modules/prosemirror-view/dist/index.js |
Posted automatically by check-eager-graph · sizes are eager output bytes (shipped, post-tree-shake) from the esbuild metafile · part of #32479
✅ Toolbar bundle — eager 2.24 MiB within budget
What the toolbar ships to customer pages, measured from the esbuild output (minified, post-tree-shake). The eager set is the entry plus everything statically imported from it — fetched before any feature runs; deferred chunks load lazily. The eager guardrail is 5.72 MiB. Each output file must also stay below 10 MB, where CloudFront stops compressing it. The module boundary is enforced separately by check-toolbar-graph.
| Metric | Size | Δ vs base | Budget |
|---|---|---|---|
| Eager (shipped) entry + static imports |
2.24 MiB · 19 files | 🟢 -152 B (-0.0%) | ████░░░░░░ 39.1% of 5.72 MiB |
| Deferred (lazy) | 2.18 MiB · 44 files | no change | n/a — loads on demand |
Loader dist/toolbar.js |
1.2 KiB | no change | █░░░░░░░░░ 6.0% of 19.5 KiB |
Largest eagerly-shipped chunks
| Size | File |
|---|---|
| 860.0 KiB | dist/toolbar/toolbar-app-XEFBXAAV.css |
| 669.7 KiB | dist/toolbar/chunk-chunk-HCO2HORG.js |
| 259.4 KiB | dist/toolbar/chunk-chunk-7DDAVWS4.js |
| 138.2 KiB | dist/toolbar/chunk-chunk-U7M7V7TH.js |
| 131.8 KiB | dist/toolbar/chunk-chunk-FDH2IBXT.js |
| 75.2 KiB | dist/toolbar/toolbar-app-CPANTPS5.js |
| 69.0 KiB | dist/toolbar/chunk-chunk-TSAL54PB.js |
| 35.6 KiB | dist/toolbar/chunk-chunk-FZE3VCV5.js |
| 21.7 KiB | dist/toolbar/chunk-chunk-H6BPIFNS.js |
| 6.8 KiB | dist/toolbar/chunk-chunk-DV7IWQNF.js |
Posted automatically by check-toolbar-size · sizes are toolbar output bytes (shipped, post-tree-shake) from the esbuild metafile
✅ Dist folder size — 🟢 -8.9 KiB (-0.0%)
Total size of the built frontend/dist folder (all assets), compared against the base branch.
Total: 1009.30 MiB · 🟢 -8.9 KiB (-0.0%)
ℹ️ MCP UI apps size — 32 app(s), 17186.0 KB JS
Built size of each MCP UI app (main.js + styles.css).
| App | JS | CSS |
|---|---|---|
| debug | 597.9 KB | 203.4 KB |
| action | 454.2 KB | 203.4 KB |
| action-list | 564.3 KB | 203.4 KB |
| cohort | 453.2 KB | 203.4 KB |
| cohort-list | 563.3 KB | 203.4 KB |
| email-template | 453.0 KB | 203.4 KB |
| error-details | 469.7 KB | 203.4 KB |
| error-issue | 454.6 KB | 203.4 KB |
| error-issue-list | 564.9 KB | 203.4 KB |
| experiment | 561.4 KB | 203.4 KB |
| experiment-list | 565.0 KB | 203.4 KB |
| experiment-results | 566.4 KB | 203.4 KB |
| feature-flag | 566.9 KB | 203.4 KB |
| feature-flag-list | 570.6 KB | 203.4 KB |
| feature-flag-testing | 457.4 KB | 203.4 KB |
| inline-scan | 453.7 KB | 203.4 KB |
| insight-actors | 562.4 KB | 203.4 KB |
| llm-costs | 559.4 KB | 203.4 KB |
| session-recording | 455.4 KB | 203.4 KB |
| survey | 454.8 KB | 203.4 KB |
| survey-global-stats | 562.0 KB | 203.4 KB |
| survey-list | 565.0 KB | 203.4 KB |
| survey-stats | 562.0 KB | 203.4 KB |
| trace-span | 453.6 KB | 203.4 KB |
| trace-span-list | 564.2 KB | 203.4 KB |
| vision-observation-list | 563.4 KB | 203.4 KB |
| workflow | 453.5 KB | 203.4 KB |
| workflow-list | 563.6 KB | 203.4 KB |
| loops-review | 457.9 KB | 203.4 KB |
| query-results | 775.6 KB | 203.4 KB |
| render-ui | 859.0 KB | 203.4 KB |
| visual-review-snapshots | 458.0 KB | 203.4 KB |
⚠️ Playwright — 1 flaky
🎭 Playwright report · View test results →
- Logout in another tab results in logout in the current tab too (chromium)
These issues are not necessarily caused by your changes.
Annoyed by this section? Help fix flakies and failures and it will go green!
⚠️ Backend coverage — 95.0% of changed backend lines covered — 7 uncovered
🧪 Backend test coverage
Patch coverage — changed backend lines (products + core): ███████████████████░ 95.0% (143 / 150)
| File | Patch | Uncovered changed lines |
|---|---|---|
products/metrics/backend/facade/contracts.py |
83.3% | 81 |
products/metrics/backend/metric_query_runner.py |
91.3% | 495, 500, 502, 504 |
products/metrics/backend/facade/api.py |
93.5% | 173, 219 |
🤖 Agents: add a test only if an uncovered line exposes a realistic regression that existing tests miss. Otherwise explain why no new test is needed under "How did you test this code?". Gap list: the patch-coverage artifact on this run (gh run download 569827026044985 -n patch-coverage), or the coverage-data block at the end of this comment.
Per-product line coverage (touched products)
| Product | Coverage | Lines |
|---|---|---|
platform_features |
██░░░░░░░░░░░░░░░░░░ 12.1% |
7 / 58 |
demo |
███████████░░░░░░░░░ 55.9% |
1,508 / 2,700 |
data_tools |
████████████░░░░░░░░ 61.2% |
90 / 147 |
warehouse_sources_queue |
█████████████░░░░░░░ 66.9% |
1,915 / 2,862 |
aeo |
███████████████░░░░░ 76.3% |
617 / 809 |
batch_exports |
████████████████░░░░ 80.1% |
21,342 / 26,651 |
apm |
█████████████████░░░ 84.1% |
1,306 / 1,553 |
engineering_analytics |
█████████████████░░░ 85.3% |
10,670 / 12,514 |
mcp_analytics |
█████████████████░░░ 85.7% |
4,844 / 5,651 |
ml_inference |
█████████████████░░░ 86.3% |
524 / 607 |
posthog_ai |
██████████████████░░ 87.7% |
4,226 / 4,817 |
cdp |
██████████████████░░ 88.0% |
4,656 / 5,290 |
notebooks |
██████████████████░░ 88.4% |
15,201 / 17,196 |
today |
██████████████████░░ 88.6% |
2,866 / 3,233 |
mcp_registry |
██████████████████░░ 89.0% |
1,596 / 1,794 |
product_tours |
██████████████████░░ 89.1% |
1,337 / 1,500 |
signals |
██████████████████░░ 89.5% |
65,868 / 73,597 |
dashboards |
██████████████████░░ 89.5% |
6,957 / 7,769 |
webmcp |
██████████████████░░ 89.6% |
240 / 268 |
cohorts |
██████████████████░░ 89.6% |
8,455 / 9,435 |
data_modeling |
██████████████████░░ 90.2% |
10,814 / 11,994 |
ai_training |
██████████████████░░ 90.4% |
349 / 386 |
tasks |
██████████████████░░ 90.5% |
80,663 / 89,086 |
visual_review |
██████████████████░░ 90.7% |
9,842 / 10,856 |
business_knowledge |
██████████████████░░ 90.9% |
8,448 / 9,295 |
canvas |
██████████████████░░ 90.9% |
7,760 / 8,535 |
exports |
██████████████████░░ 91.0% |
9,698 / 10,663 |
autoresearch |
██████████████████░░ 91.2% |
10,009 / 10,971 |
managed_warehouse |
██████████████████░░ 91.2% |
11,053 / 12,114 |
error_tracking |
██████████████████░░ 91.6% |
16,797 / 18,328 |
wizard |
██████████████████░░ 91.8% |
6,008 / 6,548 |
streamlit_apps |
██████████████████░░ 91.8% |
3,087 / 3,362 |
stamphog |
██████████████████░░ 92.0% |
8,242 / 8,963 |
conversations |
██████████████████░░ 92.1% |
29,145 / 31,640 |
warehouse_suggestions |
██████████████████░░ 92.4% |
551 / 596 |
managed_migrations |
██████████████████░░ 92.5% |
1,600 / 1,730 |
early_access_features |
███████████████████░ 92.6% |
1,339 / 1,446 |
alerts |
███████████████████░ 92.7% |
7,125 / 7,682 |
web_analytics |
███████████████████░ 93.1% |
23,968 / 25,748 |
surveys |
███████████████████░ 93.1% |
6,626 / 7,118 |
notifications |
███████████████████░ 93.2% |
1,152 / 1,236 |
approvals |
███████████████████░ 93.3% |
4,323 / 4,633 |
review_hog |
███████████████████░ 93.4% |
13,145 / 14,073 |
cross_project_dashboards |
███████████████████░ 93.4% |
880 / 942 |
slack_app |
███████████████████░ 93.5% |
14,869 / 15,897 |
context_layer |
███████████████████░ 93.7% |
3,409 / 3,640 |
marketing_analytics |
███████████████████░ 93.8% |
19,836 / 21,158 |
workflows |
███████████████████░ 93.8% |
16,372 / 17,460 |
billing_alerts |
███████████████████░ 93.9% |
2,090 / 2,226 |
customer_analytics |
███████████████████░ 93.9% |
26,079 / 27,773 |
mcp_store |
███████████████████░ 93.9% |
9,008 / 9,593 |
experiments |
███████████████████░ 94.2% |
33,524 / 35,600 |
ai_observability |
███████████████████░ 94.2% |
26,434 / 28,069 |
replay_vision |
███████████████████░ 94.3% |
28,844 / 30,594 |
actions |
███████████████████░ 94.3% |
942 / 999 |
legal_documents |
███████████████████░ 94.3% |
2,289 / 2,427 |
logs |
███████████████████░ 94.4% |
15,782 / 16,710 |
endpoints |
███████████████████░ 94.8% |
9,298 / 9,812 |
reminders |
███████████████████░ 94.8% |
760 / 802 |
growth |
███████████████████░ 94.8% |
11,268 / 11,880 |
skills |
███████████████████░ 94.9% |
7,024 / 7,403 |
annotations |
███████████████████░ 95.0% |
816 / 859 |
tracing |
███████████████████░ 95.2% |
3,617 / 3,801 |
data_catalog |
███████████████████░ 95.5% |
4,420 / 4,628 |
access_control |
███████████████████░ 95.6% |
7,693 / 8,048 |
alerts_platform |
███████████████████░ 95.7% |
4,639 / 4,848 |
product_analytics |
███████████████████░ 95.7% |
28,602 / 29,879 |
messaging |
███████████████████░ 95.8% |
3,833 / 4,003 |
revenue_analytics |
███████████████████░ 95.9% |
1,878 / 1,959 |
data_quality |
███████████████████░ 95.9% |
8,569 / 8,933 |
feature_flags |
███████████████████░ 96.2% |
27,079 / 28,144 |
warehouse_sources |
███████████████████░ 96.4% |
451,071 / 467,965 |
security |
███████████████████░ 96.7% |
1,452 / 1,501 |
pulse |
███████████████████░ 97.4% |
2,023 / 2,078 |
metrics |
████████████████████ 97.8% |
3,980 / 4,068 |
analytics_platform |
████████████████████ 98.0% |
2,775 / 2,833 |
field_notes |
████████████████████ 99.4% |
172 / 173 |
Report-only. Patch coverage = changed backend lines covered vs origin/master. Sorted lowest first.
Known gaps: lines covered only by Temporal tests show as uncovered; core line numbers may drift if master changed the same file.
✅ Hogbox preview — ready, open the preview
▶ Open the preview
| 🔑 Login | test@posthog.com / 12345678 (demo data) |
| 🧩 Running | this PR's backend and frontend, on the PostHog :master base |
| 🔗 Link | stable across rebuilds: a re-push swaps the box underneath, the URL stays |
| 🔒 Access | tailnet only (PostHog VPN) |
| 🛠️ Admin | inspect & debug state in hogland |
| 💤 Idle | sleeps after ~30 min idle (snapshot to S3, zero node cost) and wakes on your next visit in ~30s, behind a brief "waking up" screen |
commit cd3fbe9 · box box-5e06a5a48c40 · ready in 1228s (push → usable) · build log · rebuilds on every push, torn down on close

![parameterai[bot]](https://avatars.githubusercontent.com/in/2665233?s=60&v=4)

|
✅ Visual changes approved by @frankh — baseline updated in 4 removed. Install the Visual Review Chrome extension to see visual review results at the top of your pull requests. |
|
|


d8ff3f1 to
c62c06c
Compare

Drop the metric type from the metrics UI and remove the explore tab.
The builder no longer picks an aggregation by default. An unaggregated clause charts one line per series, capped at 100 series by a LIMIT subquery on the series table.
Range functions (rate, increase) and aggregations are now separate operations added through a menu, like a PromQL builder.

Generated-By: PostHog Desktop
Task-Id: 17201cbf-ec1a-4019-8eee-b92f5ce24046
0 updated, 4 removed
Run: cf2403b8-f041-4c8a-b45b-b5844ded9b3f

Co-authored-by: frankh <2088870+frankh@users.noreply.github.com>
Raw mode returns up to 100 series per clause and zero-fills each one onto the shared time grid. With 10,000 buckets one request could build millions of points. Coarsen the interval so one query has at most 500 buckets.

Generated-By: PostHog Desktop
Task-Id: 17201cbf-ec1a-4019-8eee-b92f5ce24046
…uff format

The 500-bucket limit coarsens a 30-day range to six-hour buckets, and two files needed ruff formatting.

Co-Authored-By: Claude Code <noreply@anthropic.com>

Generated-By: PostHog Desktop
Task-Id: 17201cbf-ec1a-4019-8eee-b92f5ce24046
The choices-need-a-class semgrep rule blocks inline choices lists. The query clause aggregation now uses a MetricQueryAggregation class, and the range function uses the facade MetricRangeFunction, now a LabeledStrEnum. The anomaly and explain bodies keep the AggregationEnum name through its override.

Generated-By: PostHog Desktop
Task-Id: 17201cbf-ec1a-4019-8eee-b92f5ce24046
5de1046 to
cd3fbe9
Compare


This branch was successfully deployed
3 participants


Problem
People opening a metric in the metrics viewer got an aggregation they did not choose. The builder picked
sum,avg,p95orincreasefrom the metric type. Dev data showed why this fails: remote write carries no metric type, so a counter can arrive typed as a gauge and get the wrong default. The type tag and the explore tab added more surface that depended on that type.Changes
Rate,Increase) runs on each series. An aggregation (Sum,Average,Series count,Min,Max,p95) combines series. Group by shows only when an aggregation is set.?activeTab=explorefalls back to the default tab.aggregation=nonereturns raw series, with an optionalrangeFunctionofrateorincrease.rateplussumequals the oldrate. The REST default stayssum, so the frontend sendsnoneexplicitly.aggregation=rate|increasestill open. They read as the range function plussum.Screenshots from a local stack with invented sample data (112 series for one counter, so the cap applies):
The overview now has the Overview, Viewer and SQL tabs only: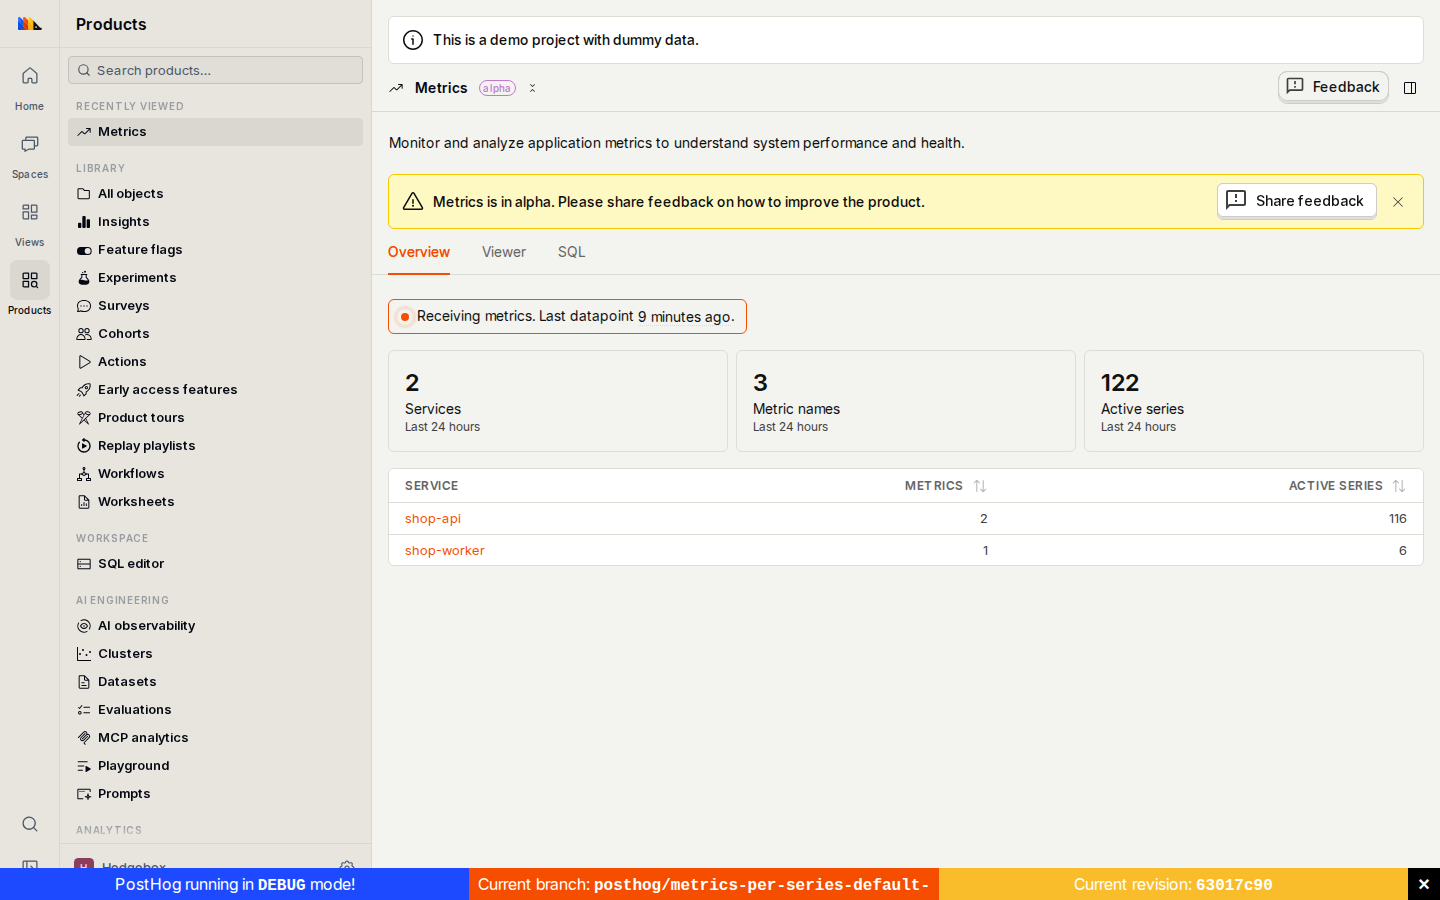
Operations demo video: pick a metric, add Rate, add Sum, group by route, remove both chips.
How did you test this code?
products/metrics/backendtests: all pass, with new cases for raw mode, the series cap and range functions.products/metrics/frontend: all 18 files pass.typescript:checkis clean andpnpm fixwas run.Test rationale: The new tests cover distinct regressions: no default aggregation on metric select, legacy
ratelinks and saved queries still restoring, range-function-only queries, and the raw series cap. The closest existing tests are inmetricsViewerLogic.test.ts,metricsSceneLogic.test.tsandtest_metric_query_runner.py, and they were updated in place.Release status
Docs update
None. Metrics is in alpha and these changes do not touch a documented workflow.
🤖 Agent context
Autonomy: Human-driven (agent-assisted)
Agent: Claude Code, claude-sonnet-5-5
/writing-pr-descriptions,/writing-ui-components,/writing-user-facing-copyand/improving-drf-endpointsskills were not available in this session, so the repo rules were applied by hand.Created with PostHog Desktop