This repository was archived by the owner on Sep 11, 2026. It is now read-only.
Repository navigation
This repository was archived by the owner on Sep 11, 2026. It is now read-only.
ML Notebook consumes all the available memory, forcing Windows to close processes #52
Description

The Training and AutoML notebook is able to consume a lot of memory, causing to hang or crash other processes.
Strangely enough, it usually works fine if you run the notebook only once. So to reproduce the problem, you should:
- Open Windows Task Manager, and check your memory usage
- Open Training and AutoML notebook

- Run it's snippets one by one, but stop at "Use AutoML to simplify trainer selection and hyper-parameter optimization."

- Run the "Use AutoML to simplify trainer selection and hyper-parameter optimization" code.

- Sometimes it works fine, but last time at this point my system hang and terminated some VS processes and closed my browser unexpectedly. Memory consumption dropped back to ~950 MBs, and the notebook got into a seemingly endless loop of "Starting Kernel".

- When I tried to re-run the "Use AutoML to simplify trainer selection and hyper-parameter optimization" code snippet again, I got the following exception, repeating over and over:

error: The JSON-RPC connection with the remote party was lost before the request could complete.
    at StreamJsonRpc.JsonRpc.<InvokeCoreAsync>d__154.MoveNext()
--- End of stack trace from previous location where exception was thrown ---
   at System.Runtime.ExceptionServices.ExceptionDispatchInfo.Throw()
   at System.Runtime.CompilerServices.TaskAwaiter.HandleNonSuccessAndDebuggerNotification(Task task)
   at StreamJsonRpc.JsonRpc.<InvokeCoreAsync>d__143`1.MoveNext()
--- End of stack trace from previous location where exception was thrown ---
   at System.Runtime.ExceptionServices.ExceptionDispatchInfo.Throw()
   at System.Runtime.CompilerServices.TaskAwaiter.HandleNonSuccessAndDebuggerNotification(Task task)
   at Microsoft.VisualStudio.Notebook.Utils.DetectKernelStatusService.<ExecuteTaskAsync>d__3.MoveNext()
--- End of stack trace from previous location where exception was thrown ---
   at System.Runtime.ExceptionServices.ExceptionDispatchInfo.Throw()
   at System.Runtime.CompilerServices.TaskAwaiter.HandleNonSuccessAndDebuggerNotification(Task task)
   at Microsoft.VisualStudio.Notebook.Utils.RepeatedTimeTaskService.<>c__DisplayClass7_0.<<ExecuteAsync>b__1>d.MoveNext()
- If you could run the notebook without issues, try to re-run the "Use AutoML to simplify trainer selection and hyper-parameter optimization" code many times, it is inconsistent on my machine as well.
Activity
LittleLittleCloud commentedon Jul 6, 2022
I suspect it's because the trial is still running even after that automl cell finished. Somehow AutoMLExperiment doesn't always succeed in cancelling the last running trial..
JakeRadMSFT commentedon Jul 7, 2022
We probably also need to clean up some things in our NotebookMonitor -
https://github.com/dotnet/machinelearning/blob/main/src/Microsoft.ML.AutoML.Interactive/NotebookMonitor.cs
It could be holding references to a lot of things.
@andrasfuchs if you "restart kernel" does it free up the memory for you?
I'll dig more to see if I can find anything.
andrasfuchs commentedon Jul 11, 2022
@JakeRadMSFT How can I restart the kernel?
JakeRadMSFT commentedon Jul 12, 2022
@andrasfuchs if you’re using latest notebook editor extension there is a restart button in notebook toolbar.
andrasfuchs commentedon Jul 13, 2022
I tried it again today, but after a "Run All", it got crazy again, eating up the memory and closing other running processes.
The critical part got terminated with an exception.
The memory was not freed up after the exception, I had to close the Visual Studio process manually.
I had no chance to test the kernel restart.
JakeRadMSFT commentedon Jul 13, 2022
@LittleLittleCloud thoughts here?
LittleLittleCloud commentedon Jul 13, 2022
I was thinking there's some places we forget to clear trial result and release memory (like hold all models in memory) but I didn't see the memory goes up while training. So now I suspect the crazy memory usage is caused by LightGbm trainer, which is possible to have bad-memory allocation especially when the search space goes big
@andrasfuchs Can you try disable lgbm trainer by setting
useLgbm: falsenext touseSdca:falsein the following code snippet

and try the notebook again
LittleLittleCloud commentedon Jul 13, 2022
And @JakeRadMSFT , maybe it would be helpful to add a system monitor section together with trial Monitor?
andrasfuchs commentedon Jul 17, 2022
I got the gray rectangles instead of the results, but the memory problem seems to be better if I use
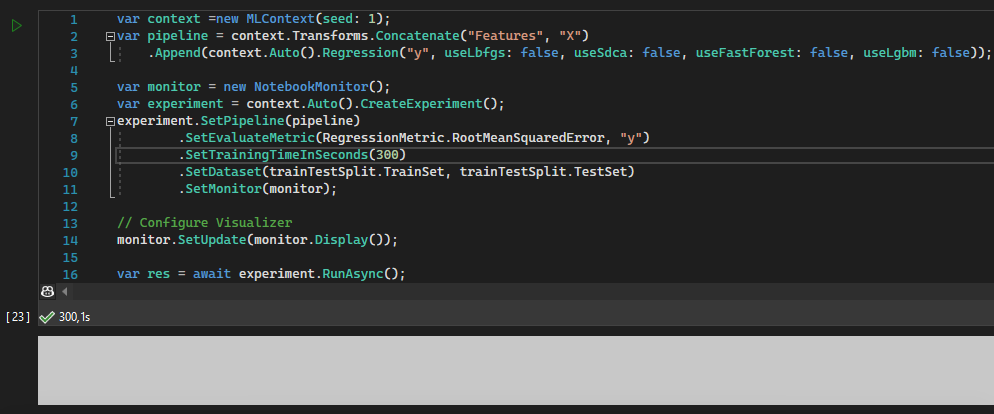
useLgbm: false.10+ GBs of RAM usage is still a lot, I think...

...and this memory is not freed up after the notebook run was completed.