Repository navigation
[Perf] Regressions from inliner policy change #114996

Description

Run Information
| Name | Value |
|---|---|
| Architecture | arm64 |
| OS | ubuntu 22.04 |
| Queue | AmpereUbuntu |
| Baseline | 27d23218a56d484638692d56b3abd27e0b21b591 |
| Compare | d9c4c3e73dcf09435a3cc1cabb23584c9f24b504 |
| Diff | Diff |
| Configs | CompilationMode:tiered, RunKind:micro |
Regressions in System.Memory.ReadOnlySpan
| Benchmark | Baseline | Test | Test/Base | Test Quality | Edge Detector | Baseline IR | Compare IR | IR Ratio |
|---|---|---|---|---|---|---|---|---|
| 39.46 ns | 45.49 ns | 1.15 | 0.00 | False | ||||
| 250.88 ns | 300.80 ns | 1.20 | 0.11 | False | ||||
| 22.82 ns | 28.21 ns | 1.24 | 0.00 | False | ||||
| 30.78 ns | 36.42 ns | 1.18 | 0.00 | False | ||||
| 27.12 ns | 32.08 ns | 1.18 | 0.00 | False |


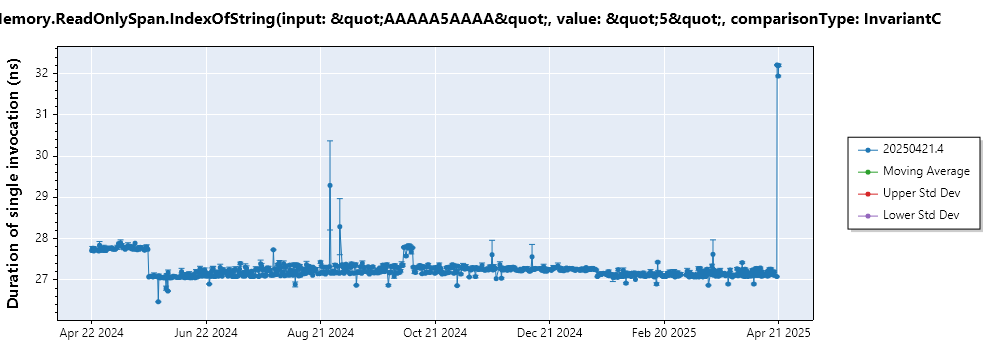
Repro
General Docs link: https://github.com/dotnet/performance/blob/main/docs/benchmarking-workflow-dotnet-runtime.md
git clone https://github.com/dotnet/performance.git
python3 .\performance\scripts\benchmarks_ci.py -f net8.0 --filter 'System.Memory.ReadOnlySpan*'
Details
System.Memory.ReadOnlySpan.IndexOfString(input: "foobardzsdzs", value: "rddzs", comparisonType: InvariantCulture)
ETL Files
Histogram
JIT Disasms
System.Memory.ReadOnlySpan.IndexOfString(input: "AAAAAAAAAAAAAAAAAAAAAAAAAAAAAAAAAAAAAAAAAAAAAAAAAAAAAAAAAAAAAAAAAAAAAAXAAAAAAAAAAAAAAAAAAAAAAAAAAAAA", value: "x", comparisonType: InvariantCultureIgnoreCase)
ETL Files
Histogram
JIT Disasms
System.Memory.ReadOnlySpan.IndexOfString(input: "ABCDE", value: "c", comparisonType: InvariantCultureIgnoreCase)
ETL Files
Histogram
JIT Disasms
System.Memory.ReadOnlySpan.IndexOfString(input: "string1", value: "string2", comparisonType: InvariantCulture)
ETL Files
Histogram
JIT Disasms
System.Memory.ReadOnlySpan.IndexOfString(input: "AAAAA5AAAA", value: "5", comparisonType: InvariantCulture)
ETL Files
Histogram
JIT Disasms
Docs
Profiling workflow for dotnet/runtime repository
Benchmarking workflow for dotnet/runtime repository
Run Information
| Name | Value |
|---|---|
| Architecture | arm64 |
| OS | ubuntu 22.04 |
| Queue | AmpereUbuntu |
| Baseline | 27d23218a56d484638692d56b3abd27e0b21b591 |
| Compare | d9c4c3e73dcf09435a3cc1cabb23584c9f24b504 |
| Diff | Diff |
| Configs | CompilationMode:tiered, RunKind:micro |
Regressions in System.Text.Json.Tests.Perf_Basic
| Benchmark | Baseline | Test | Test/Base | Test Quality | Edge Detector | Baseline IR | Compare IR | IR Ratio |
|---|---|---|---|---|---|---|---|---|
| 1.82 ms | 2.02 ms | 1.11 | 0.01 | False | ||||
| 569.82 ns | 632.04 ns | 1.11 | 0.00 | False | ||||
| 1.78 ms | 2.04 ms | 1.15 | 0.00 | False | ||||
| 606.24 ns | 661.19 ns | 1.09 | 0.00 | False |


Repro
General Docs link: https://github.com/dotnet/performance/blob/main/docs/benchmarking-workflow-dotnet-runtime.md
git clone https://github.com/dotnet/performance.git
python3 .\performance\scripts\benchmarks_ci.py -f net8.0 --filter 'System.Text.Json.Tests.Perf_Basic*'
Details
System.Text.Json.Tests.Perf_Basic.WriteBasicUtf16(Formatted: False, SkipValidation: True, DataSize: 100000)
ETL Files
Histogram
JIT Disasms
System.Text.Json.Tests.Perf_Basic.WriteBasicUtf8(Formatted: False, SkipValidation: True, DataSize: 10)
ETL Files
Histogram
JIT Disasms
System.Text.Json.Tests.Perf_Basic.WriteBasicUtf8(Formatted: False, SkipValidation: True, DataSize: 100000)
ETL Files
Histogram
JIT Disasms
System.Text.Json.Tests.Perf_Basic.WriteBasicUtf8(Formatted: False, SkipValidation: False, DataSize: 10)
ETL Files
Histogram
JIT Disasms
Docs
Profiling workflow for dotnet/runtime repository
Benchmarking workflow for dotnet/runtime repository
Run Information
| Name | Value |
|---|---|
| Architecture | arm64 |
| OS | ubuntu 22.04 |
| Queue | AmpereUbuntu |
| Baseline | 27d23218a56d484638692d56b3abd27e0b21b591 |
| Compare | d9c4c3e73dcf09435a3cc1cabb23584c9f24b504 |
| Diff | Diff |
| Configs | CompilationMode:tiered, RunKind:micro |
Regressions in System.Tests.Perf_Guid
| Benchmark | Baseline | Test | Test/Base | Test Quality | Edge Detector | Baseline IR | Compare IR | IR Ratio |
|---|---|---|---|---|---|---|---|---|
| 33.19 ns | 35.91 ns | 1.08 | 0.01 | False | ||||
| 33.05 ns | 36.90 ns | 1.12 | 0.01 | False |


Repro
General Docs link: https://github.com/dotnet/performance/blob/main/docs/benchmarking-workflow-dotnet-runtime.md
git clone https://github.com/dotnet/performance.git
python3 .\performance\scripts\benchmarks_ci.py -f net8.0 --filter 'System.Tests.Perf_Guid*'
Details
System.Tests.Perf_Guid.ctor_str
ETL Files
Histogram
JIT Disasms
System.Tests.Perf_Guid.ParseExactD
ETL Files
Histogram
JIT Disasms
Docs
Profiling workflow for dotnet/runtime repository
Benchmarking workflow for dotnet/runtime repository
Run Information
| Name | Value |
|---|---|
| Architecture | arm64 |
| OS | ubuntu 22.04 |
| Queue | AmpereUbuntu |
| Baseline | 27d23218a56d484638692d56b3abd27e0b21b591 |
| Compare | d9c4c3e73dcf09435a3cc1cabb23584c9f24b504 |
| Diff | Diff |
| Configs | CompilationMode:tiered, RunKind:micro |
Regressions in System.Text.RegularExpressions.Tests.Perf_Regex_Industry_RustLang_Sherlock
| Benchmark | Baseline | Test | Test/Base | Test Quality | Edge Detector | Baseline IR | Compare IR | IR Ratio |
|---|---|---|---|---|---|---|---|---|
| 231.75 μs | 244.13 μs | 1.05 | 0.00 | False | ||||
| 158.99 μs | 166.98 μs | 1.05 | 0.00 | False |


Repro
General Docs link: https://github.com/dotnet/performance/blob/main/docs/benchmarking-workflow-dotnet-runtime.md
git clone https://github.com/dotnet/performance.git
python3 .\performance\scripts\benchmarks_ci.py -f net8.0 --filter 'System.Text.RegularExpressions.Tests.Perf_Regex_Industry_RustLang_Sherlock*'
Details
System.Text.RegularExpressions.Tests.Perf_Regex_Industry_RustLang_Sherlock.Count(Pattern: "(?i)Holmes", Options: None)
ETL Files
Histogram
JIT Disasms
System.Text.RegularExpressions.Tests.Perf_Regex_Industry_RustLang_Sherlock.Count(Pattern: "(?i)Sherlock Holmes", Options: NonBacktracking)
ETL Files
Histogram
JIT Disasms
Docs
Profiling workflow for dotnet/runtime repository
Benchmarking workflow for dotnet/runtime repository
Run Information
| Name | Value |
|---|---|
| Architecture | arm64 |
| OS | ubuntu 22.04 |
| Queue | AmpereUbuntu |
| Baseline | 27d23218a56d484638692d56b3abd27e0b21b591 |
| Compare | d9c4c3e73dcf09435a3cc1cabb23584c9f24b504 |
| Diff | Diff |
| Configs | CompilationMode:tiered, RunKind:micro |
Regressions in System.Buffers.Tests.RentReturnArrayPoolTests<Byte>
| Benchmark | Baseline | Test | Test/Base | Test Quality | Edge Detector | Baseline IR | Compare IR | IR Ratio |
|---|---|---|---|---|---|---|---|---|
| 337.73 ns | 407.52 ns | 1.21 | 0.03 | False | ||||
| 54.42 μs | 61.41 μs | 1.13 | 0.43 | False | ||||
| 8.46 μs | 9.47 μs | 1.12 | 0.06 | False |


Repro
General Docs link: https://github.com/dotnet/performance/blob/main/docs/benchmarking-workflow-dotnet-runtime.md
git clone https://github.com/dotnet/performance.git
python3 .\performance\scripts\benchmarks_ci.py -f net8.0 --filter 'System.Buffers.Tests.RentReturnArrayPoolTests<Byte>*'
Details
System.Buffers.Tests.RentReturnArrayPoolTests<Byte>.MultipleSerial(RentalSize: 4096, ManipulateArray: False, Async: False, UseSharedPool: False)
ETL Files
Histogram
JIT Disasms
System.Buffers.Tests.RentReturnArrayPoolTests<Byte>.SingleParallel(RentalSize: 4096, ManipulateArray: True, Async: False, UseSharedPool: False)
ETL Files
Histogram
JIT Disasms
System.Buffers.Tests.RentReturnArrayPoolTests<Byte>.SingleParallel(RentalSize: 4096, ManipulateArray: False, Async: False, UseSharedPool: False)
ETL Files
Histogram
JIT Disasms
Docs
Profiling workflow for dotnet/runtime repository
Benchmarking workflow for dotnet/runtime repository
Run Information
| Name | Value |
|---|---|
| Architecture | arm64 |
| OS | ubuntu 22.04 |
| Queue | AmpereUbuntu |
| Baseline | 27d23218a56d484638692d56b3abd27e0b21b591 |
| Compare | d9c4c3e73dcf09435a3cc1cabb23584c9f24b504 |
| Diff | Diff |
| Configs | CompilationMode:tiered, RunKind:micro |
Regressions in System.Text.Json.Document.Tests.Perf_ParseThenWrite
| Benchmark | Baseline | Test | Test/Base | Test Quality | Edge Detector | Baseline IR | Compare IR | IR Ratio |
|---|---|---|---|---|---|---|---|---|
| 19.70 μs | 22.00 μs | 1.12 | 0.04 | False | ||||
| 13.30 μs | 16.23 μs | 1.22 | 0.01 | False | ||||
| 1.39 ms | 1.65 ms | 1.19 | 0.28 | False |


Repro
General Docs link: https://github.com/dotnet/performance/blob/main/docs/benchmarking-workflow-dotnet-runtime.md
git clone https://github.com/dotnet/performance.git
python3 .\performance\scripts\benchmarks_ci.py -f net8.0 --filter 'System.Text.Json.Document.Tests.Perf_ParseThenWrite*'
Details
System.Text.Json.Document.Tests.Perf_ParseThenWrite.ParseThenWrite(IsDataIndented: True, TestCase: DeepTree)
ETL Files
Histogram
JIT Disasms
System.Text.Json.Document.Tests.Perf_ParseThenWrite.ParseThenWrite(IsDataIndented: False, TestCase: Json4KB)
ETL Files
Histogram
JIT Disasms
System.Text.Json.Document.Tests.Perf_ParseThenWrite.ParseThenWrite(IsDataIndented: False, TestCase: Json400KB)
ETL Files
Histogram
JIT Disasms
Docs
Profiling workflow for dotnet/runtime repository
Benchmarking workflow for dotnet/runtime repository
Run Information
| Name | Value |
|---|---|
| Architecture | arm64 |
| OS | ubuntu 22.04 |
| Queue | AmpereUbuntu |
| Baseline | 27d23218a56d484638692d56b3abd27e0b21b591 |
| Compare | d9c4c3e73dcf09435a3cc1cabb23584c9f24b504 |
| Diff | Diff |
| Configs | CompilationMode:tiered, RunKind:micro |
Regressions in System.Globalization.Tests.StringSearch
| Benchmark | Baseline | Test | Test/Base | Test Quality | Edge Detector | Baseline IR | Compare IR | IR Ratio |
|---|---|---|---|---|---|---|---|---|
| 821.17 ns | 898.62 ns | 1.09 | 0.01 | False | ||||
| 541.36 ns | 614.16 ns | 1.13 | 0.11 | False | ||||
| 539.89 ns | 613.38 ns | 1.14 | 0.11 | False | ||||
| 821.32 ns | 901.57 ns | 1.10 | 0.01 | False | ||||
| 540.29 ns | 613.34 ns | 1.14 | 0.10 | False | ||||
| 852.78 ns | 926.97 ns | 1.09 | 0.09 | False |


Repro
General Docs link: https://github.com/dotnet/performance/blob/main/docs/benchmarking-workflow-dotnet-runtime.md
git clone https://github.com/dotnet/performance.git
python3 .\performance\scripts\benchmarks_ci.py -f net8.0 --filter 'System.Globalization.Tests.StringSearch*'
Details
System.Globalization.Tests.StringSearch.IndexOf_Word_NotFound(Options: (en-US, IgnoreCase, False))
ETL Files
Histogram
JIT Disasms
System.Globalization.Tests.StringSearch.IndexOf_Word_NotFound(Options: (, None, False))
ETL Files
Histogram
JIT Disasms
System.Globalization.Tests.StringSearch.IndexOf_Word_NotFound(Options: (en-US, IgnoreNonSpace, False))
ETL Files
Histogram
JIT Disasms
System.Globalization.Tests.StringSearch.IndexOf_Word_NotFound(Options: (, IgnoreCase, False))
ETL Files
Histogram
JIT Disasms
System.Globalization.Tests.StringSearch.IndexOf_Word_NotFound(Options: (en-US, None, False))
ETL Files
Histogram
JIT Disasms
System.Globalization.Tests.StringSearch.LastIndexOf_Word_NotFound(Options: (en-US, IgnoreCase, False))
ETL Files
Histogram
JIT Disasms
Docs
Profiling workflow for dotnet/runtime repository
Benchmarking workflow for dotnet/runtime repository
Run Information
| Name | Value |
|---|---|
| Architecture | arm64 |
| OS | ubuntu 22.04 |
| Queue | AmpereUbuntu |
| Baseline | 27d23218a56d484638692d56b3abd27e0b21b591 |
| Compare | d9c4c3e73dcf09435a3cc1cabb23584c9f24b504 |
| Diff | Diff |
| Configs | CompilationMode:tiered, RunKind:micro |
Regressions in System.Buffers.Tests.RentReturnArrayPoolTests<Object>
| Benchmark | Baseline | Test | Test/Base | Test Quality | Edge Detector | Baseline IR | Compare IR | IR Ratio |
|---|---|---|---|---|---|---|---|---|
| 339.43 ns | 398.33 ns | 1.17 | 0.02 | False |

Repro
General Docs link: https://github.com/dotnet/performance/blob/main/docs/benchmarking-workflow-dotnet-runtime.md
git clone https://github.com/dotnet/performance.git
python3 .\performance\scripts\benchmarks_ci.py -f net8.0 --filter 'System.Buffers.Tests.RentReturnArrayPoolTests<Object>*'
Details
System.Buffers.Tests.RentReturnArrayPoolTests<Object>.MultipleSerial(RentalSize: 4096, ManipulateArray: False, Async: False, UseSharedPool: False)
ETL Files
Histogram
JIT Disasms
Docs
Profiling workflow for dotnet/runtime repository
Benchmarking workflow for dotnet/runtime repository
Run Information
| Name | Value |
|---|---|
| Architecture | arm64 |
| OS | ubuntu 22.04 |
| Queue | AmpereUbuntu |
| Baseline | 27d23218a56d484638692d56b3abd27e0b21b591 |
| Compare | d9c4c3e73dcf09435a3cc1cabb23584c9f24b504 |
| Diff | Diff |
| Configs | CompilationMode:tiered, RunKind:micro |
Regressions in System.Text.Json.Tests.Utf8JsonReaderCommentsTests
| Benchmark | Baseline | Test | Test/Base | Test Quality | Edge Detector | Baseline IR | Compare IR | IR Ratio |
|---|---|---|---|---|---|---|---|---|
| 4.41 μs | 4.78 μs | 1.08 | 0.00 | False |

Repro
General Docs link: https://github.com/dotnet/performance/blob/main/docs/benchmarking-workflow-dotnet-runtime.md
git clone https://github.com/dotnet/performance.git
python3 .\performance\scripts\benchmarks_ci.py -f net8.0 --filter 'System.Text.Json.Tests.Utf8JsonReaderCommentsTests*'
Details
System.Text.Json.Tests.Utf8JsonReaderCommentsTests.Utf8JsonReaderCommentParsing(CommentHandling: Skip, SegmentSize: 0, TestCase: LongMultiLine)
ETL Files
Histogram
JIT Disasms
Docs
Profiling workflow for dotnet/runtime repository
Benchmarking workflow for dotnet/runtime repository
Run Information
| Name | Value |
|---|---|
| Architecture | arm64 |
| OS | ubuntu 22.04 |
| Queue | AmpereUbuntu |
| Baseline | 27d23218a56d484638692d56b3abd27e0b21b591 |
| Compare | d9c4c3e73dcf09435a3cc1cabb23584c9f24b504 |
| Diff | Diff |
| Configs | CompilationMode:tiered, RunKind:micro |
Regressions in System.Globalization.Tests.StringEquality
| Benchmark | Baseline | Test | Test/Base | Test Quality | Edge Detector | Baseline IR | Compare IR | IR Ratio |
|---|---|---|---|---|---|---|---|---|
| 1.38 μs | 1.72 μs | 1.25 | 0.00 | False |

Repro
General Docs link: https://github.com/dotnet/performance/blob/main/docs/benchmarking-workflow-dotnet-runtime.md
git clone https://github.com/dotnet/performance.git
python3 .\performance\scripts\benchmarks_ci.py -f net8.0 --filter 'System.Globalization.Tests.StringEquality*'
Details
System.Globalization.Tests.StringEquality.Compare_Same(Count: 1024, Options: (en-US, OrdinalIgnoreCase))
ETL Files
Histogram
JIT Disasms
Docs
Profiling workflow for dotnet/runtime repository
Benchmarking workflow for dotnet/runtime repository
Activity
performanceautofiler commentedon Apr 24, 2025
Run Information
Regressions in System.Collections.Sort<BigStruct>
Test Report
Repro
General Docs link: https://github.com/dotnet/performance/blob/main/docs/benchmarking-workflow-dotnet-runtime.md
Details
System.Collections.Sort<BigStruct>.LinqOrderByExtension(Size: 512)
ETL Files
Histogram
JIT Disasms
System.Collections.Sort<BigStruct>.LinqQuery(Size: 512)
ETL Files
Histogram
JIT Disasms
Docs
Profiling workflow for dotnet/runtime repository
Benchmarking workflow for dotnet/runtime repository
Run Information
Regressions in System.Text.Json.Serialization.Tests.WriteJson<ImmutableSortedDictionary<String, String>>
Test Report
Repro
General Docs link: https://github.com/dotnet/performance/blob/main/docs/benchmarking-workflow-dotnet-runtime.md
Details
System.Text.Json.Serialization.Tests.WriteJson<ImmutableSortedDictionary<String, String>>.SerializeToUtf8Bytes(Mode: SourceGen)
ETL Files
Histogram
JIT Disasms
System.Text.Json.Serialization.Tests.WriteJson<ImmutableSortedDictionary<String, String>>.SerializeToString(Mode: SourceGen)
ETL Files
Histogram
JIT Disasms
Docs
Profiling workflow for dotnet/runtime repository
Benchmarking workflow for dotnet/runtime repository
AndyAyersMS commentedon Apr 24, 2025
#114821
[-][Perf] Linux/arm64: 32 Regressions on 4/21/2025 2:03:19 AM +00:00[/-][+][Perf] Regressions from inliner policy change[/+]AndyAyersMS commentedon Apr 24, 2025
Related regressions:
More reports (possibly dups):
dotnet-policy-service commentedon Apr 25, 2025
Tagging subscribers to this area: @JulieLeeMSFT, @jakobbotsch
See info in area-owners.md if you want to be subscribed.
11 remaining items
AndyAyersMS commentedon Aug 9, 2025
Actually this seems to be fixed(*) with latest main after all...
(* the lab is not showing this... I will have to look again)
AndyAyersMS commentedon Aug 9, 2025
System.Net.Tests.Perf_WebUtility.Decode_DecodingRequired
Very simple root method. We run out of inline budget after inlining
System.Net.WebUtility:UrlDecodeInternaland leave some of its key callees un-inlined.We perhaps should make a similar noinline fix here like we did in #118544 (say on the
Url.Decodemethods).Mark UrlDecodeInternal noinline to work around inliner limitation
AndyAyersMS commentedon Aug 11, 2025
What I see locally is that the app is now bimodal, with a slow time (like the regression) and a fast time (like the above). Now to figure out why...
In the "slow" case we're able to inline
System.Globalization.CultureInfo:GetFormat(System.Type):System.Object:thisinto the benchmark root, and then subsequent inlines fail with budget issues:This call to
GetFormatcomes fromSystem.Globalization.NumberFormatInfo:<GetInstance>g__GetProviderNonNull|58_0and in the slow case we don't have PGO data for that method; in the fast case we do (and it makes the call site cold).g__GetProviderNonNull|58_0seems to be prejitted as the first event we see is a Tier1+Instr. So seems to (possibly) be the result of it taking a while for that code to make it live, and how much data it's been able to gather before the root method is jitted.My local benchmark setup may be perturbing things somewhat as I'm using a checked jit and enabling dumping for the benchmark root, which presumably slows down the compilation of that method some and makes seeing the fast result more likely (for me slow runs are rare). But lab data is flipped the other way, though it does show occasional fast runs (on some platforms, here viper windows):
Assuming this is the problem it's not clear if there a good fix; ideally we'd want to defer rejitting of callers until instrumented callees had had a chance to run for a bit, but we have no way of knowing that. In realistic apps we can hope there is more "distance" in the rejit queue between callers and callees (hot callees should generally trigger rejitting before their callers).
We might consider upping the budget yet again (like we did in #114191). So let me see if using release bits flips the distribution back to mostly slow/sometimes fast, and then see what the budget needs to be to flip it back.
AndyAyersMS commentedon Aug 12, 2025
Seems like just a tiny increase in budget (from 20 -> 21) fixes this. Tempting. Let me see if that also helps fix
Decode_DecodingRequiredJIT: slightly increase the inline budget
JIT: slightly increase the inline budget (#118641)
AndyAyersMS commentedon Aug 13, 2025
After #118641
Addressed most but not all of the regression, and on both of these we are now close release/release (compare to last August).
Refreshing the full set of initial regressions, we see we're mainly seeing issues on tiger which at this point are lower priority (though it's important to cross-check in ADX what happens elsewhere).
So plan is to focus on the viper regressions next. First I am going to look at the XML serialization test, it is now fairly unstable but seems worse on average (orange line)
and then maybe at
and
2.59
1.57
1.94
1.63
1.33
1.50
1.66
1.25
1.39
1.73
1.45
1.31
1.37
1.26
1.17
1.07
1.23
1.27
1.12
1.12
1.21
1.08
1.10
1.08
1.13
1.12
1.25
1.35
1.36
1.25
1.17
1.09
1.18
1.09
1.63
1.17
1.13
1.10
1.05
1.18
1.09
1.18
1.21
1.09
1.17
1.18
1.14
1.14
1.11
1.16
1.09
1.19
1.18
1.12
1.15
1.06
1.21
1.15
1.14
1.14
1.10
1.28
1.08
1.06
1.44
1.31
1.15
1.07
1.11
1.09
1.11
1.18
1.07
1.10
1.07
1.18
1.08
1.11
1.12
1.05
1.12
1.05
1.17
1.14
1.18
1.30
1.22
1.11
1.11
1.07
1.26
1.08
1.25
1.69
1.23
1.09
1.10
1.07
1.06
1.06
2.71
1.12
1.07
1.13
1.14
1.20
1.08
1.21
1.38
1.11
1.10
1.09
1.07
1.05
1.20
1.26
1.22
1.23
1.15
1.20
1.17
1.38
1.14
1.19
1.16
1.10
1.12
1.14
1.14
1.13
1.34
1.17
1.36
1.38
1.12
1.20
1.08
1.08
1.10
1.18
1.07
1.08
1.18
1.39
1.24
1.11
1.34
1.12
1.15
1.10
1.11
1.11
1.06
1.09
1.27
AndyAyersMS commentedon Aug 15, 2025
Not going to have enough time to chase all these down in .NET 10, so moving to .NET 11. Will keep looking and see if there are any simple fixes we might still consider taking.
AndyAyersMS commentedon Aug 19, 2025
Array pool benchmarks showed improvements on Viper (dotnet/perf-autofiling-issues#60843) with the latest PGO update.
AndyAyersMS commentedon Jun 7, 2026
Note
Status update prepared with assistance from GitHub Copilot CLI.
Status update
Coming back to this in
.NET 11:The original PR's code change is no longer in main. The
dynamicPgoNOINLINE-suppression block added in JIT: don't mark callees noinline for non-fatal observations with pgo #114821 was silently removed as part of Return false in PropagateNeverToRuntime for BBJ_THROW blocks #118280 (Aug 2025 — the PR title only mentions aBBJ_THROWchange inPropagateNeverToRuntime, but the diff also dropped the entire suppression hunk inInlineResult::Report).Re-adding the JIT: don't mark callees noinline for non-fatal observations with pgo #114821 suppression on top of current
maindoes not change perf on the worst remaining entry from the original list. Verified locally on a Zen3 box:HEADvsHEAD+ the JIT: don't mark callees noinline for non-fatal observations with pgo #114821 suppression restored, on all 8 (method ×Formatted×SkipValidation) combos ofPerf_Basic.WriteBasic*atDataSize=100000, produced deltas within ±2% (noise). So whatever mechanism originally introduced these regressions is no longer the current cause for any benchmark that's still showing one.The follow-up fixes (JIT: allow inliner to use up more of the lva "budget" #118515 / Mark the vectorized CRC update methods noinline #118544 / JIT: slightly increase the inline budget #118641) plus the Aug-2025 PGO data refresh ([Perf] Windows/x64: 19 Improvements on 8/15/2025 5:36:08 AM +00:00 perf-autofiling-issues#60843, now closed) account for the originally-listed benchmarks that have since recovered. The benchmarks in the original table that still show >5% delta against the pre-
27d23218baseline are now likely independent regressions, not symptoms of JIT: don't mark callees noinline for non-fatal observations with pgo #114821.Remaining items are mostly tracked by existing autofiling issues:
Perf_Basic.WriteBasicUtf8(Formatted: False, SkipValidation: True, DataSize: 100000)on viper-windows (~+12% on top of the older delta, between0bda60e7and6130a50f) is filed as [Perf] Windows/x64: 8 Regressions on 4/27/2026 2:35:20 PM +00:00 perf-autofiling-issues#72462.RentReturn*viper variants and the tiger-* string/regex entries from the original table don't appear to share a root cause with JIT: don't mark callees noinline for non-fatal observations with pgo #114821 and are largely covered by their own per-cluster autofiling issues.Given the above, I think this can be closed and any further work tracked in the per-benchmark autofiling issues.