This report is a translation of plotly/plotly.py#1085
It seems that the scatter3d.line.color and scatter3d.line.colorscale properties can be used to specify a line with a variable color along it's path (which is awesome!). There is also as scatter3d.line.showscale property in the schema, but setting this to true does not show a colorscale.
Not sure if the bug is the scale not showing, or the presence of the showscale property. Thanks!
Codepen: https://codepen.io/anon/pen/vaRLgy
x = [0, 0, 0]
y = [1, 1, 1]
z = [1, 2, 3]
c = [0, 1, 2]
var trace1 = {
    type: 'scatter3d',
    x: x,
    y: y,
    z: z,
    mode: "lines",
    line: {
        color: c,
        showscale: true,
        width: 10
    }
}


var data = [ trace1 ];

var layout = {};

Plotly.newPlot('myDiv', data, layout);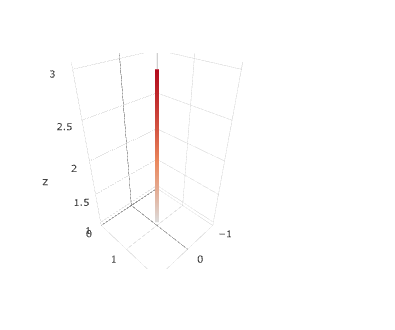

This report is a translation of plotly/plotly.py#1085
It seems that the
scatter3d.line.colorandscatter3d.line.colorscaleproperties can be used to specify a line with a variable color along it's path (which is awesome!). There is also asscatter3d.line.showscaleproperty in the schema, but setting this totruedoes not show a colorscale.Not sure if the bug is the scale not showing, or the presence of the
showscaleproperty. Thanks!Codepen: https://codepen.io/anon/pen/vaRLgy