I just did a fresh install to try plotly.py and wanted to try the pandas windrose example from the plotly site ( https://plot.ly/pandas/wind-rose-charts/ ).
import pandas as pd
import colorlover as cl
import numpy as np
import plotly.plotly as py
import plotly.graph_objs as go


df = pd.read_csv('https://raw.githubusercontent.com/plotly/datasets/master/wind_rose.csv')
df.head()

data = []
counter = 0
for col in df.columns:
    if col != 'r':
        data.append(
            go.Area(t=df['r'],
                    r=df[col],
                    marker=dict(color=cl.scales['9']['seq']['PuBu'][counter]),
                    name=col+' m/s' ) )
        counter+=1
layout = go.Layout(
    title='test wr',
    font=dict(
        size=16
    ),

    radialaxis=dict(
        ticksuffix='%'
    ),
    orientation=270,
    barmode="stack"

)
fig = go.FigureWidget(data=data, layout=layout)
fig
but i only get a blank output cell.
if i remove the barmode="stack" kwarg, the plot renders, but without data:

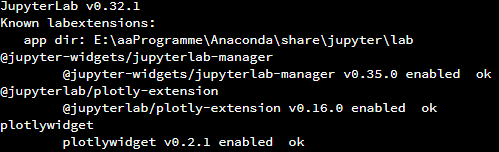
Plotly Version: 3.1.1
Update:
i managed to get the plot and data to display, it seems using the pandas columns for "r" and "t" values doesn´t work (as in #1116).
However, dynamically updating the plot (e.g. changing title color) doesn´t work.

I just did a fresh install to try plotly.py and wanted to try the pandas windrose example from the plotly site ( https://plot.ly/pandas/wind-rose-charts/ ).
but i only get a blank output cell.
if i remove the

barmode="stack"kwarg, the plot renders, but without data:Plotly Version: 3.1.1

Update:
i managed to get the plot and data to display, it seems using the pandas columns for "r" and "t" values doesn´t work (as in #1116).
However, dynamically updating the plot (e.g. changing title color) doesn´t work.
